Course Progress
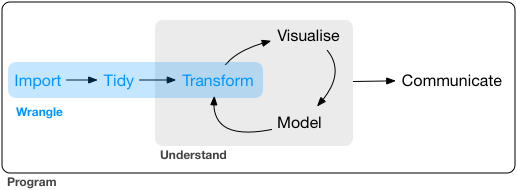
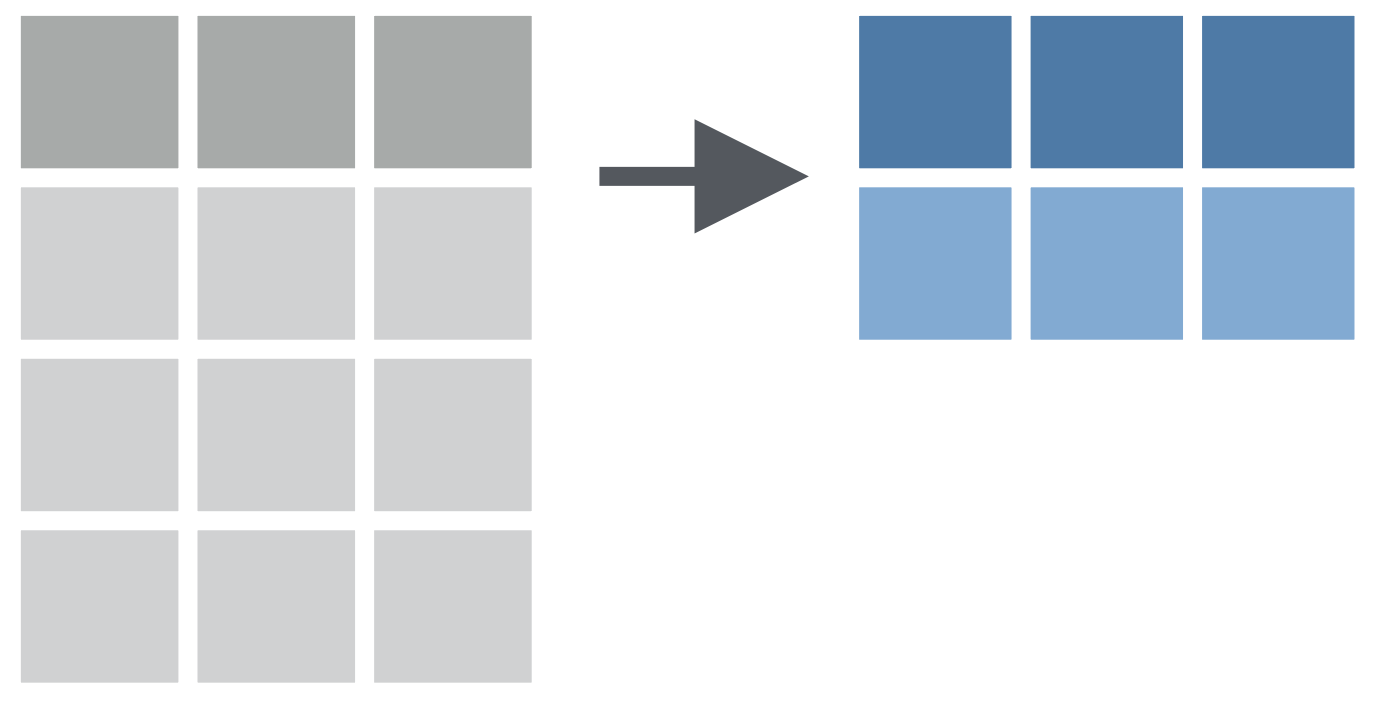
What is Data wrangling?
What is Data wrangling?
"data exploration and data manipulation" (Jesse Mostipak)
"tidying and transforming" (Hadley & Garrett)
What is Data wrangling?
"data exploration and data manipulation" (Jesse Mostipak)
"tidying and transforming" (Hadley & Garrett)

"Transforming" data means:
- "narrowing in on observations of interest ...
"Transforming" data means:
"narrowing in on observations of interest ...
creating new variables that are functions of existing variables ... and
"Transforming" data means:
"narrowing in on observations of interest ...
creating new variables that are functions of existing variables ... and
calculating a set of summary statistics."
R
Package
dplyr package
- "dplyr is a grammar of data manipulation"
dplyr package
"dplyr is a grammar of data manipulation"
"providing a consistent set of verbs that help you solve the most common data manipulation challenges:"
dplyr package
"dplyr is a grammar of data manipulation"
"providing a consistent set of verbs that help you solve the most common data manipulation challenges:"
Few important functions:
filter()select()mutate()arrange()summarise()
filter() function:
- Picks cases based on their values.
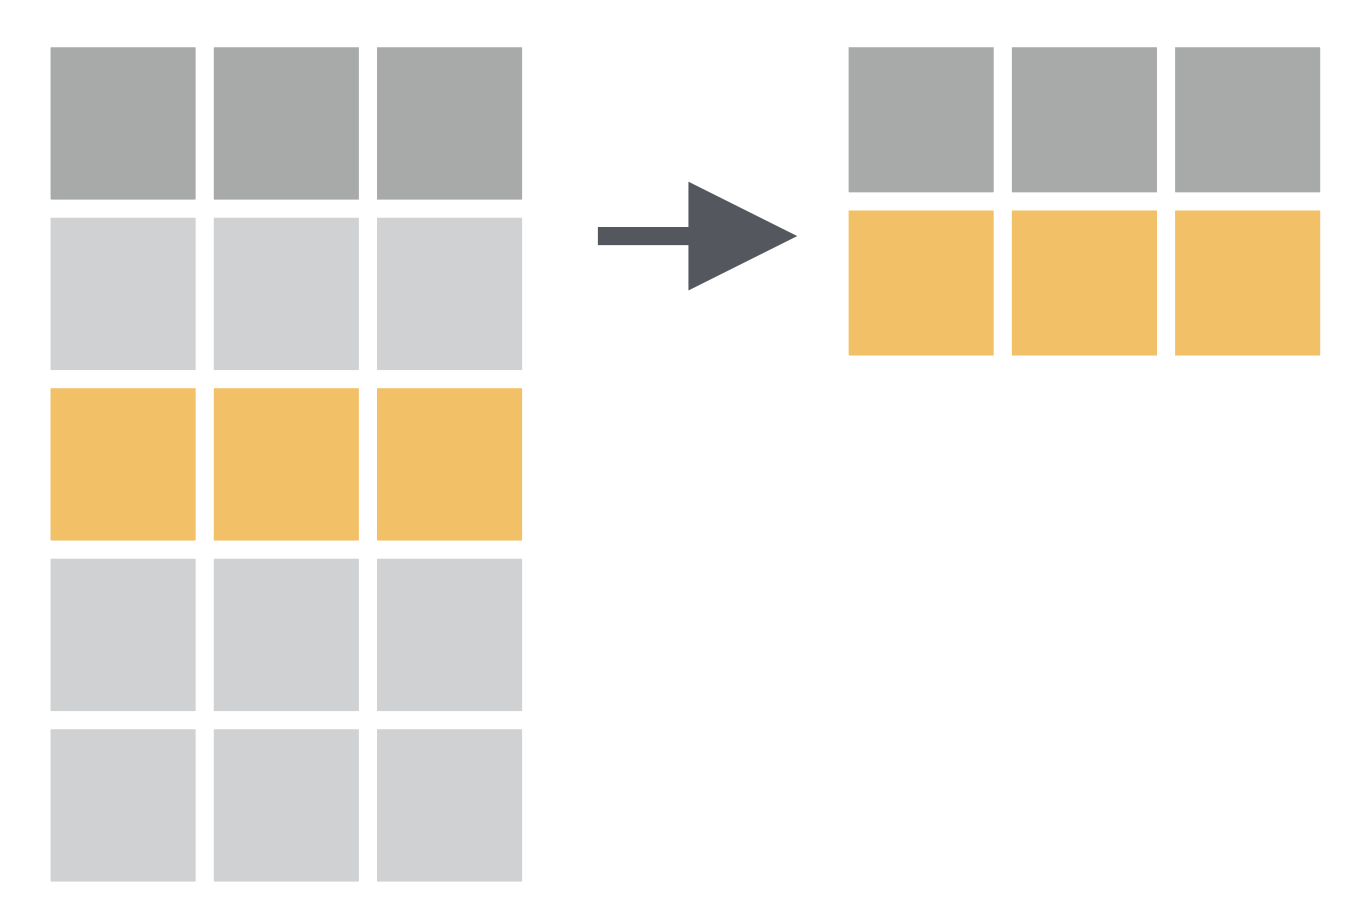
How to have a data of only Gentoo penguins?
# there are three species: Chinstrap, Gentoo, Adeliepenguins %>% filter(species == "Gentoo")## # A tibble: 124 × 8## species island bill_length_mm bill_depth_mm flipper_len…¹ body_…² sex year## <fct> <fct> <dbl> <dbl> <int> <int> <fct> <int>## 1 Gentoo Biscoe 46.1 13.2 211 4500 fema… 2007## 2 Gentoo Biscoe 50 16.3 230 5700 male 2007## 3 Gentoo Biscoe 48.7 14.1 210 4450 fema… 2007## 4 Gentoo Biscoe 50 15.2 218 5700 male 2007## 5 Gentoo Biscoe 47.6 14.5 215 5400 male 2007## 6 Gentoo Biscoe 46.5 13.5 210 4550 fema… 2007## 7 Gentoo Biscoe 45.4 14.6 211 4800 fema… 2007## 8 Gentoo Biscoe 46.7 15.3 219 5200 male 2007## 9 Gentoo Biscoe 43.3 13.4 209 4400 fema… 2007## 10 Gentoo Biscoe 46.8 15.4 215 5150 male 2007## # … with 114 more rows, and abbreviated variable names ¹flipper_length_mm,## # ²body_mass_g# there are three species: Chinstrap, Gentoo, Adeliepraw <- read_csv("data/gentoo-penguins1.csv")praw %>% filter(species == "Gentoo") %>% summary() %>% kableExtra::kable()| species | island | bill_length_mm | bill_depth_mm | flipper_length_mm | body_mass_g | sex | year | |
|---|---|---|---|---|---|---|---|---|
| Length:124 | Length:124 | Min. :40.90 | Min. :13.10 | Min. :203.0 | Min. :3950 | Length:124 | Min. :2007 | |
| Class :character | Class :character | 1st Qu.:45.30 | 1st Qu.:14.20 | 1st Qu.:212.0 | 1st Qu.:4500 | Class :character | 1st Qu.:2007 | |
| Mode :character | Mode :character | Median :47.30 | Median :15.00 | Median :216.0 | Median :4925 | Mode :character | Median :2008 | |
| NA | NA | Mean :47.50 | Mean :14.98 | Mean :217.2 | Mean :4985 | NA | Mean :2008 | |
| NA | NA | 3rd Qu.:49.55 | 3rd Qu.:15.70 | 3rd Qu.:221.0 | 3rd Qu.:5400 | NA | 3rd Qu.:2009 | |
| NA | NA | Max. :59.60 | Max. :17.30 | Max. :231.0 | Max. :6050 | NA | Max. :2009 | |
| NA | NA | NA's :1 | NA's :1 | NA's :1 | NA's :1 | NA | NA |
How to export data file to your computer?
✋ WAIT! What is %>%
✋ WAIT! What is %>%
- this is called pipe (
%>%= control + shift + m)
✋ WAIT! What is %>%
this is called pipe (
%>%= control + shift + m)"a powerful tool for clearly expressing a sequence of multiple operations"
✋ WAIT! What is %>%
this is called pipe (
%>%= control + shift + m)"a powerful tool for clearly expressing a sequence of multiple operations"
interpret/read it as then.
penguins %>% filter(species == "Gentoo") %>% summary() %>% kableExtra::kable()Comparison: Relational Operators
x < y
Comparison: Relational Operators
x < y
x > y
Comparison: Relational Operators
x < y
x > y
x <= y
Comparison: Relational Operators
x < y
x > y
x <= y
x >= y
Comparison: Relational Operators
x < y
x > y
x <= y
x >= y
x == y (equal)
Comparison: Relational Operators
x < y
x > y
x <= y
x >= y
x == y (equal)
x != y (not equal)
How to have a data of penguins with bill length more than 43 mm?
penguins %>% filter(bill_length_mm > 43)## # A tibble: 188 × 8## species island bill_length_mm bill_depth_mm flipper_…¹ body_…² sex year## <fct> <fct> <dbl> <dbl> <int> <int> <fct> <int>## 1 Adelie Torgersen 46 21.5 194 4200 male 2007## 2 Adelie Dream 44.1 19.7 196 4400 male 2007## 3 Adelie Torgersen 45.8 18.9 197 4150 male 2008## 4 Adelie Dream 43.2 18.5 192 4100 male 2008## 5 Adelie Biscoe 43.2 19 197 4775 male 2009## 6 Adelie Biscoe 45.6 20.3 191 4600 male 2009## 7 Adelie Torgersen 44.1 18 210 4000 male 2009## 8 Adelie Torgersen 43.1 19.2 197 3500 male 2009## 9 Gentoo Biscoe 46.1 13.2 211 4500 fema… 2007## 10 Gentoo Biscoe 50 16.3 230 5700 male 2007## # … with 178 more rows, and abbreviated variable names ¹flipper_length_mm,## # ²body_mass_gHow to have a data of Gentoo penguins with bill length more than 55 mm?
penguins %>% filter(species == "Gentoo", bill_length_mm > 55)## # A tibble: 3 × 8## species island bill_length_mm bill_depth_mm flipper_leng…¹ body_…² sex year## <fct> <fct> <dbl> <dbl> <int> <int> <fct> <int>## 1 Gentoo Biscoe 59.6 17 230 6050 male 2007## 2 Gentoo Biscoe 55.9 17 228 5600 male 2009## 3 Gentoo Biscoe 55.1 16 230 5850 male 2009## # … with abbreviated variable names ¹flipper_length_mm, ²body_mass_gHow to have data of non-Gentoo penguins with bill length more than 45 mm and weight more than 4 kg?
penguins %>% filter(species != "Gentoo", bill_length_mm > 45, body_mass_g > 4000)## # A tibble: 18 × 8## species island bill_length_mm bill_depth_mm flippe…¹ body_…² sex year## <fct> <fct> <dbl> <dbl> <int> <int> <fct> <int>## 1 Adelie Torgersen 46 21.5 194 4200 male 2007## 2 Adelie Torgersen 45.8 18.9 197 4150 male 2008## 3 Adelie Biscoe 45.6 20.3 191 4600 male 2009## 4 Chinstrap Dream 46 18.9 195 4150 fema… 2007## 5 Chinstrap Dream 52 18.1 201 4050 male 2007## 6 Chinstrap Dream 50.5 19.6 201 4050 male 2007## 7 Chinstrap Dream 49.2 18.2 195 4400 male 2007## 8 Chinstrap Dream 52 19 197 4150 male 2007## 9 Chinstrap Dream 52.8 20 205 4550 male 2008## 10 Chinstrap Dream 54.2 20.8 201 4300 male 2008## 11 Chinstrap Dream 51 18.8 203 4100 male 2008## 12 Chinstrap Dream 52 20.7 210 4800 male 2008## 13 Chinstrap Dream 53.5 19.9 205 4500 male 2008## 14 Chinstrap Dream 50.8 18.5 201 4450 male 2009## 15 Chinstrap Dream 49 19.6 212 4300 male 2009## 16 Chinstrap Dream 50.7 19.7 203 4050 male 2009## 17 Chinstrap Dream 49.3 19.9 203 4050 male 2009## 18 Chinstrap Dream 50.8 19 210 4100 male 2009## # … with abbreviated variable names ¹flipper_length_mm, ²body_mass_gHow to have only top or bottom rows from data?
penguins %>% filter(species != "Gentoo", bill_length_mm > 45, body_mass_g > 4000) %>% head()## # A tibble: 6 × 8## species island bill_length_mm bill_depth_mm flipper…¹ body_…² sex year## <fct> <fct> <dbl> <dbl> <int> <int> <fct> <int>## 1 Adelie Torgersen 46 21.5 194 4200 male 2007## 2 Adelie Torgersen 45.8 18.9 197 4150 male 2008## 3 Adelie Biscoe 45.6 20.3 191 4600 male 2009## 4 Chinstrap Dream 46 18.9 195 4150 fema… 2007## 5 Chinstrap Dream 52 18.1 201 4050 male 2007## 6 Chinstrap Dream 50.5 19.6 201 4050 male 2007## # … with abbreviated variable names ¹flipper_length_mm, ²body_mass_gpenguins %>% filter(species != "Gentoo", bill_length_mm > 45, body_mass_g > 4000) %>% tail(3)## # A tibble: 3 × 8## species island bill_length_mm bill_depth_mm flipper_le…¹ body_…² sex year## <fct> <fct> <dbl> <dbl> <int> <int> <fct> <int>## 1 Chinstrap Dream 50.7 19.7 203 4050 male 2009## 2 Chinstrap Dream 49.3 19.9 203 4050 male 2009## 3 Chinstrap Dream 50.8 19 210 4100 male 2009## # … with abbreviated variable names ¹flipper_length_mm, ²body_mass_g🧠 YOUR TURN
10:00
How many Chinstrap penguins are with bill length more than 45 mm and weight more than 4 kg?
penguins %>% filter(species == "Chinstrap", bill_length_mm > 45, body_mass_g > 4000) %>% head()## # A tibble: 6 × 8## species island bill_length_mm bill_depth_mm flipper_le…¹ body_…² sex year## <fct> <fct> <dbl> <dbl> <int> <int> <fct> <int>## 1 Chinstrap Dream 46 18.9 195 4150 fema… 2007## 2 Chinstrap Dream 52 18.1 201 4050 male 2007## 3 Chinstrap Dream 50.5 19.6 201 4050 male 2007## 4 Chinstrap Dream 49.2 18.2 195 4400 male 2007## 5 Chinstrap Dream 52 19 197 4150 male 2007## 6 Chinstrap Dream 52.8 20 205 4550 male 2008## # … with abbreviated variable names ¹flipper_length_mm, ²body_mass_gselect() function: Chooses rows based on column values.
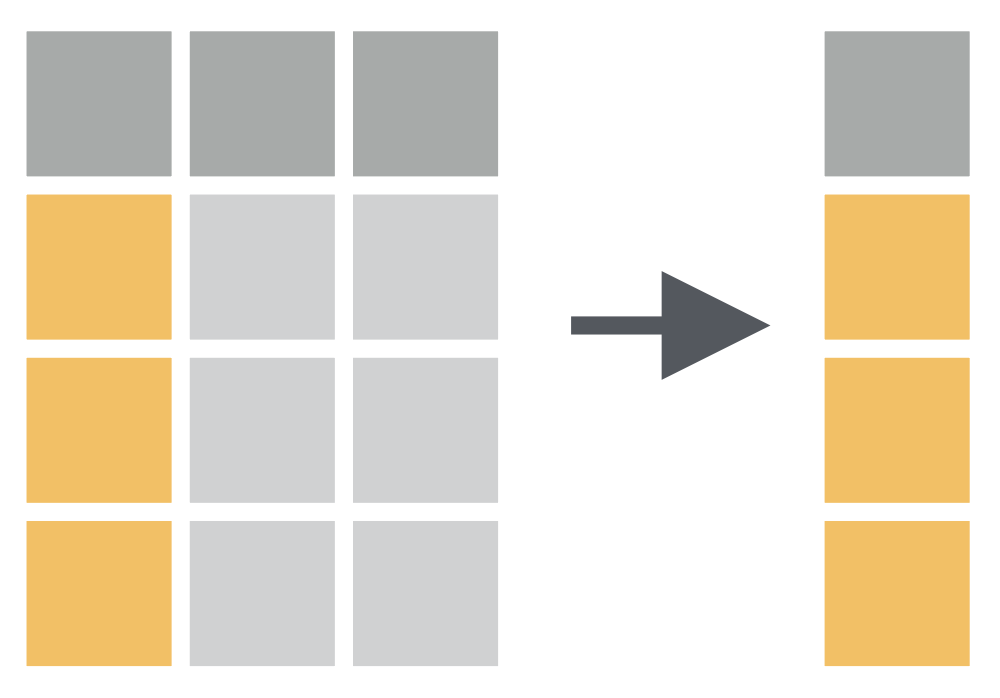
How to have only species variable in data?
How to have a specific range of variables in data?
penguins %>% select(species : bill_depth_mm)## # A tibble: 344 × 4## species island bill_length_mm bill_depth_mm## <fct> <fct> <dbl> <dbl>## 1 Adelie Torgersen 39.1 18.7## 2 Adelie Torgersen 39.5 17.4## 3 Adelie Torgersen 40.3 18 ## 4 Adelie Torgersen NA NA ## 5 Adelie Torgersen 36.7 19.3## 6 Adelie Torgersen 39.3 20.6## 7 Adelie Torgersen 38.9 17.8## 8 Adelie Torgersen 39.2 19.6## 9 Adelie Torgersen 34.1 18.1## 10 Adelie Torgersen 42 20.2## # … with 334 more rowsHow to have variables based upon their location in data?
penguins %>% select(4:8)## # A tibble: 344 × 5## bill_depth_mm flipper_length_mm body_mass_g sex year## <dbl> <int> <int> <fct> <int>## 1 18.7 181 3750 male 2007## 2 17.4 186 3800 female 2007## 3 18 195 3250 female 2007## 4 NA NA NA <NA> 2007## 5 19.3 193 3450 female 2007## 6 20.6 190 3650 male 2007## 7 17.8 181 3625 female 2007## 8 19.6 195 4675 male 2007## 9 18.1 193 3475 <NA> 2007## 10 20.2 190 4250 <NA> 2007## # … with 334 more rowsHow to have specific variables in data?
penguins %>% select(species, body_mass_g, year)## # A tibble: 344 × 3## species body_mass_g year## <fct> <int> <int>## 1 Adelie 3750 2007## 2 Adelie 3800 2007## 3 Adelie 3250 2007## 4 Adelie NA 2007## 5 Adelie 3450 2007## 6 Adelie 3650 2007## 7 Adelie 3625 2007## 8 Adelie 4675 2007## 9 Adelie 3475 2007## 10 Adelie 4250 2007## # … with 334 more rowspenguins %>% select(-c(species, body_mass_g, year))## # A tibble: 344 × 5## island bill_length_mm bill_depth_mm flipper_length_mm sex ## <fct> <dbl> <dbl> <int> <fct> ## 1 Torgersen 39.1 18.7 181 male ## 2 Torgersen 39.5 17.4 186 female## 3 Torgersen 40.3 18 195 female## 4 Torgersen NA NA NA <NA> ## 5 Torgersen 36.7 19.3 193 female## 6 Torgersen 39.3 20.6 190 male ## 7 Torgersen 38.9 17.8 181 female## 8 Torgersen 39.2 19.6 195 male ## 9 Torgersen 34.1 18.1 193 <NA> ## 10 Torgersen 42 20.2 190 <NA> ## # … with 334 more rowsmutate() function: Adds new variables that are functions of existing variables
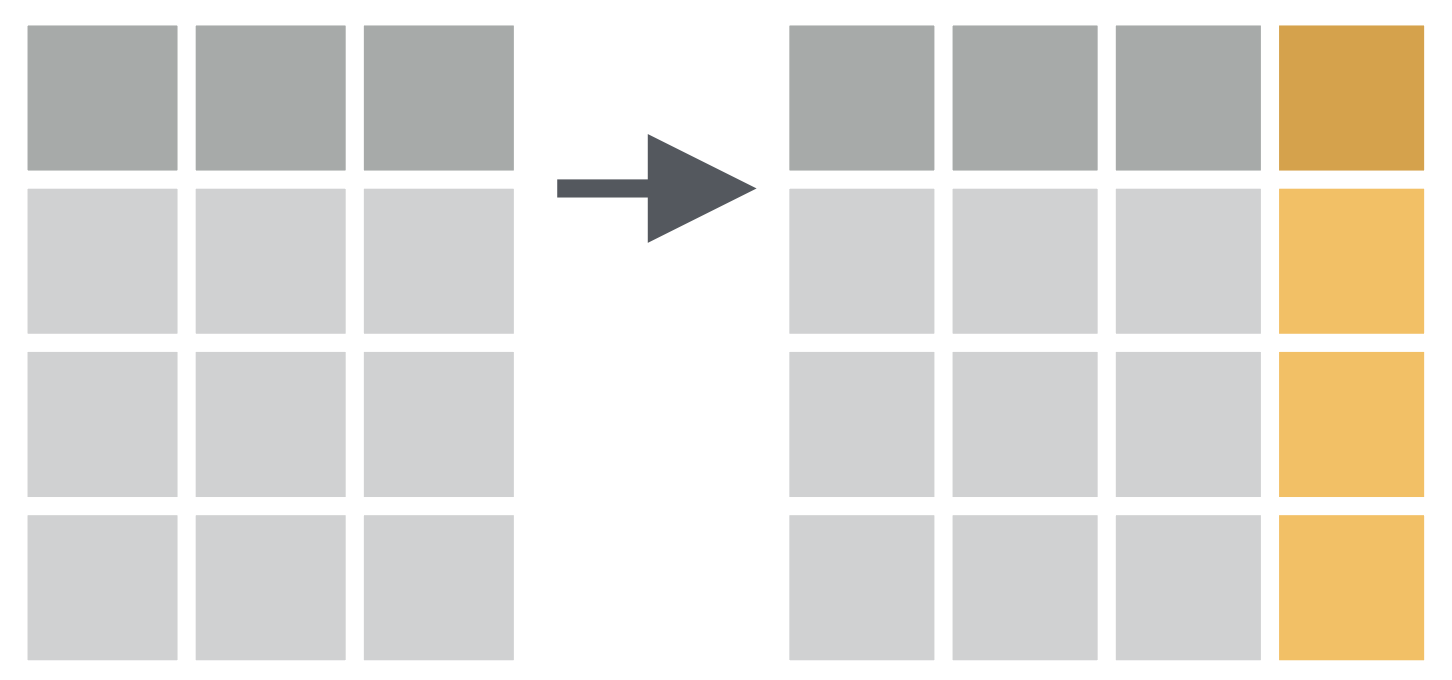
How to convert penguin body mass from grams to kilograms?
penguins %>% mutate(body_mass_kg = body_mass_g / 1000)## # A tibble: 344 × 9## species island bill_length_mm bill_d…¹ flipp…² body_…³ sex year body_…⁴## <fct> <fct> <dbl> <dbl> <int> <int> <fct> <int> <dbl>## 1 Adelie Torgersen 39.1 18.7 181 3750 male 2007 3.75## 2 Adelie Torgersen 39.5 17.4 186 3800 fema… 2007 3.8 ## 3 Adelie Torgersen 40.3 18 195 3250 fema… 2007 3.25## 4 Adelie Torgersen NA NA NA NA <NA> 2007 NA ## 5 Adelie Torgersen 36.7 19.3 193 3450 fema… 2007 3.45## 6 Adelie Torgersen 39.3 20.6 190 3650 male 2007 3.65## 7 Adelie Torgersen 38.9 17.8 181 3625 fema… 2007 3.62## 8 Adelie Torgersen 39.2 19.6 195 4675 male 2007 4.68## 9 Adelie Torgersen 34.1 18.1 193 3475 <NA> 2007 3.48## 10 Adelie Torgersen 42 20.2 190 4250 <NA> 2007 4.25## # … with 334 more rows, and abbreviated variable names ¹bill_depth_mm,## # ²flipper_length_mm, ³body_mass_g, ⁴body_mass_kgpenguins %>% select(body_mass_g) %>% mutate(body_mass_kg = body_mass_g / 1000)## # A tibble: 344 × 2## body_mass_g body_mass_kg## <int> <dbl>## 1 3750 3.75## 2 3800 3.8 ## 3 3250 3.25## 4 NA NA ## 5 3450 3.45## 6 3650 3.65## 7 3625 3.62## 8 4675 4.68## 9 3475 3.48## 10 4250 4.25## # … with 334 more rowspenguins %>% mutate(body_mass_kg = body_mass_g / 1000, bill = bill_length_mm * bill_depth_mm)## # A tibble: 344 × 10## species island bill_le…¹ bill_…² flipp…³ body_…⁴ sex year body_…⁵ bill## <fct> <fct> <dbl> <dbl> <int> <int> <fct> <int> <dbl> <dbl>## 1 Adelie Torgersen 39.1 18.7 181 3750 male 2007 3.75 731.## 2 Adelie Torgersen 39.5 17.4 186 3800 fema… 2007 3.8 687.## 3 Adelie Torgersen 40.3 18 195 3250 fema… 2007 3.25 725.## 4 Adelie Torgersen NA NA NA NA <NA> 2007 NA NA ## 5 Adelie Torgersen 36.7 19.3 193 3450 fema… 2007 3.45 708.## 6 Adelie Torgersen 39.3 20.6 190 3650 male 2007 3.65 810.## 7 Adelie Torgersen 38.9 17.8 181 3625 fema… 2007 3.62 692.## 8 Adelie Torgersen 39.2 19.6 195 4675 male 2007 4.68 768.## 9 Adelie Torgersen 34.1 18.1 193 3475 <NA> 2007 3.48 617.## 10 Adelie Torgersen 42 20.2 190 4250 <NA> 2007 4.25 848.## # … with 334 more rows, and abbreviated variable names ¹bill_length_mm,## # ²bill_depth_mm, ³flipper_length_mm, ⁴body_mass_g, ⁵body_mass_kgpenguins %>% mutate(body_mass_kg = body_mass_g / 1000, bill = bill_length_mm * bill_depth_mm) %>% select(body_mass_kg, bill)## # A tibble: 344 × 2## body_mass_kg bill## <dbl> <dbl>## 1 3.75 731.## 2 3.8 687.## 3 3.25 725.## 4 NA NA ## 5 3.45 708.## 6 3.65 810.## 7 3.62 692.## 8 4.68 768.## 9 3.48 617.## 10 4.25 848.## # … with 334 more rowsarrange() function: Changes the order of the rows.
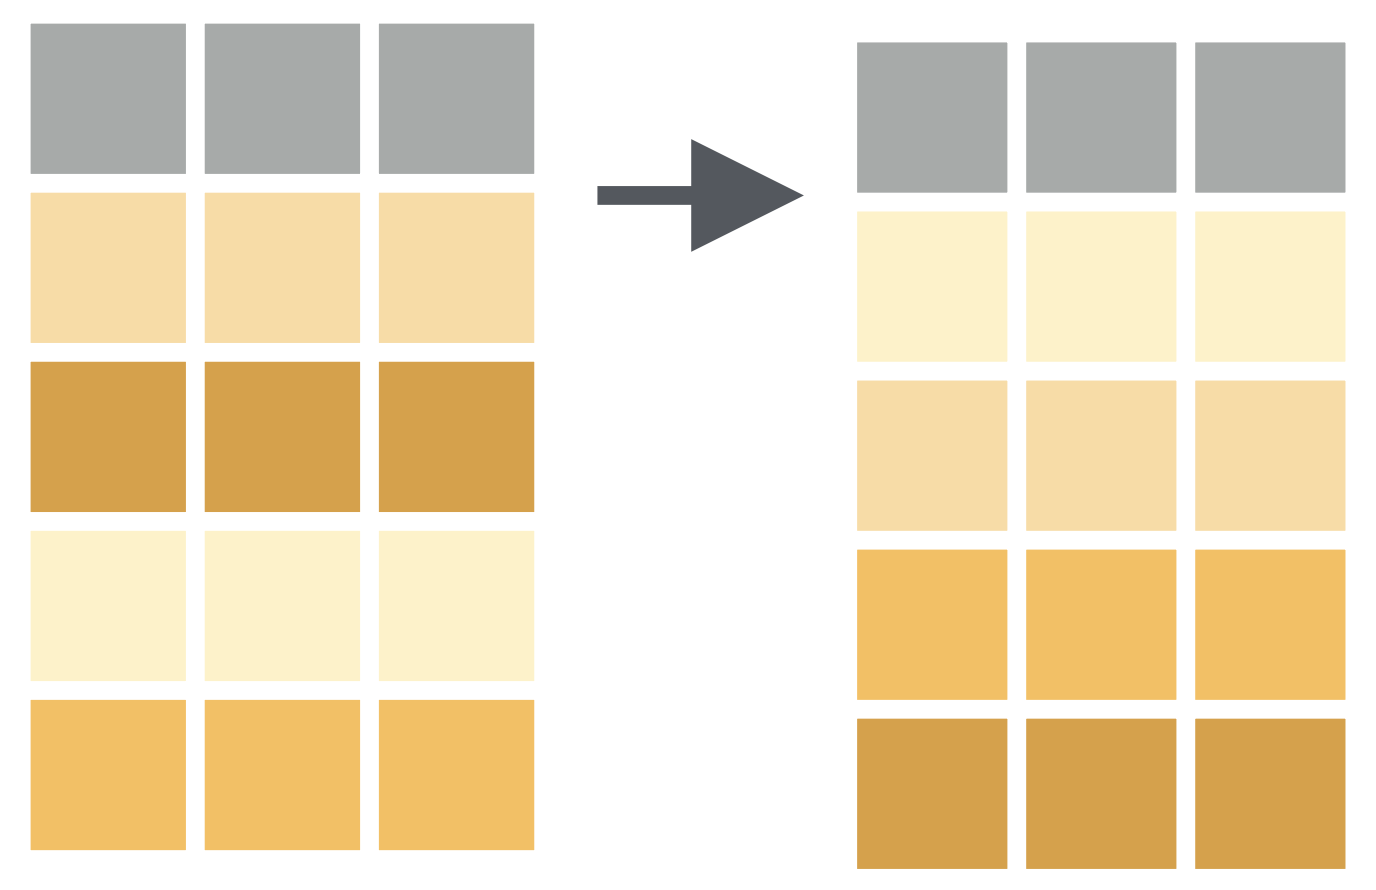
How to have data arranged by the ascending order of bill length of penguins?
penguins %>% arrange(bill_length_mm)## # A tibble: 344 × 8## species island bill_length_mm bill_depth_mm flipper_…¹ body_…² sex year## <fct> <fct> <dbl> <dbl> <int> <int> <fct> <int>## 1 Adelie Dream 32.1 15.5 188 3050 fema… 2009## 2 Adelie Dream 33.1 16.1 178 2900 fema… 2008## 3 Adelie Torgersen 33.5 19 190 3600 fema… 2008## 4 Adelie Dream 34 17.1 185 3400 fema… 2008## 5 Adelie Torgersen 34.1 18.1 193 3475 <NA> 2007## 6 Adelie Torgersen 34.4 18.4 184 3325 fema… 2007## 7 Adelie Biscoe 34.5 18.1 187 2900 fema… 2008## 8 Adelie Torgersen 34.6 21.1 198 4400 male 2007## 9 Adelie Torgersen 34.6 17.2 189 3200 fema… 2008## 10 Adelie Biscoe 35 17.9 190 3450 fema… 2008## # … with 334 more rows, and abbreviated variable names ¹flipper_length_mm,## # ²body_mass_gpenguins %>% arrange(desc(bill_length_mm))## # A tibble: 344 × 8## species island bill_length_mm bill_depth_mm flipper_l…¹ body_…² sex year## <fct> <fct> <dbl> <dbl> <int> <int> <fct> <int>## 1 Gentoo Biscoe 59.6 17 230 6050 male 2007## 2 Chinstrap Dream 58 17.8 181 3700 fema… 2007## 3 Gentoo Biscoe 55.9 17 228 5600 male 2009## 4 Chinstrap Dream 55.8 19.8 207 4000 male 2009## 5 Gentoo Biscoe 55.1 16 230 5850 male 2009## 6 Gentoo Biscoe 54.3 15.7 231 5650 male 2008## 7 Chinstrap Dream 54.2 20.8 201 4300 male 2008## 8 Chinstrap Dream 53.5 19.9 205 4500 male 2008## 9 Gentoo Biscoe 53.4 15.8 219 5500 male 2009## 10 Chinstrap Dream 52.8 20 205 4550 male 2008## # … with 334 more rows, and abbreviated variable names ¹flipper_length_mm,## # ²body_mass_gpenguins %>% arrange(species)## # A tibble: 344 × 8## species island bill_length_mm bill_depth_mm flipper_…¹ body_…² sex year## <fct> <fct> <dbl> <dbl> <int> <int> <fct> <int>## 1 Adelie Torgersen 39.1 18.7 181 3750 male 2007## 2 Adelie Torgersen 39.5 17.4 186 3800 fema… 2007## 3 Adelie Torgersen 40.3 18 195 3250 fema… 2007## 4 Adelie Torgersen NA NA NA NA <NA> 2007## 5 Adelie Torgersen 36.7 19.3 193 3450 fema… 2007## 6 Adelie Torgersen 39.3 20.6 190 3650 male 2007## 7 Adelie Torgersen 38.9 17.8 181 3625 fema… 2007## 8 Adelie Torgersen 39.2 19.6 195 4675 male 2007## 9 Adelie Torgersen 34.1 18.1 193 3475 <NA> 2007## 10 Adelie Torgersen 42 20.2 190 4250 <NA> 2007## # … with 334 more rows, and abbreviated variable names ¹flipper_length_mm,## # ²body_mass_gsummarise() function
summarise() function: Chooses rows based on column values.
