R
Package
xaringan
- xaringan package to be a Presentation Ninja 🤺
xaringan
xaringan package to be a Presentation Ninja 🤺
"for creating slideshows with remark.js through R Markdown"
Packages required:
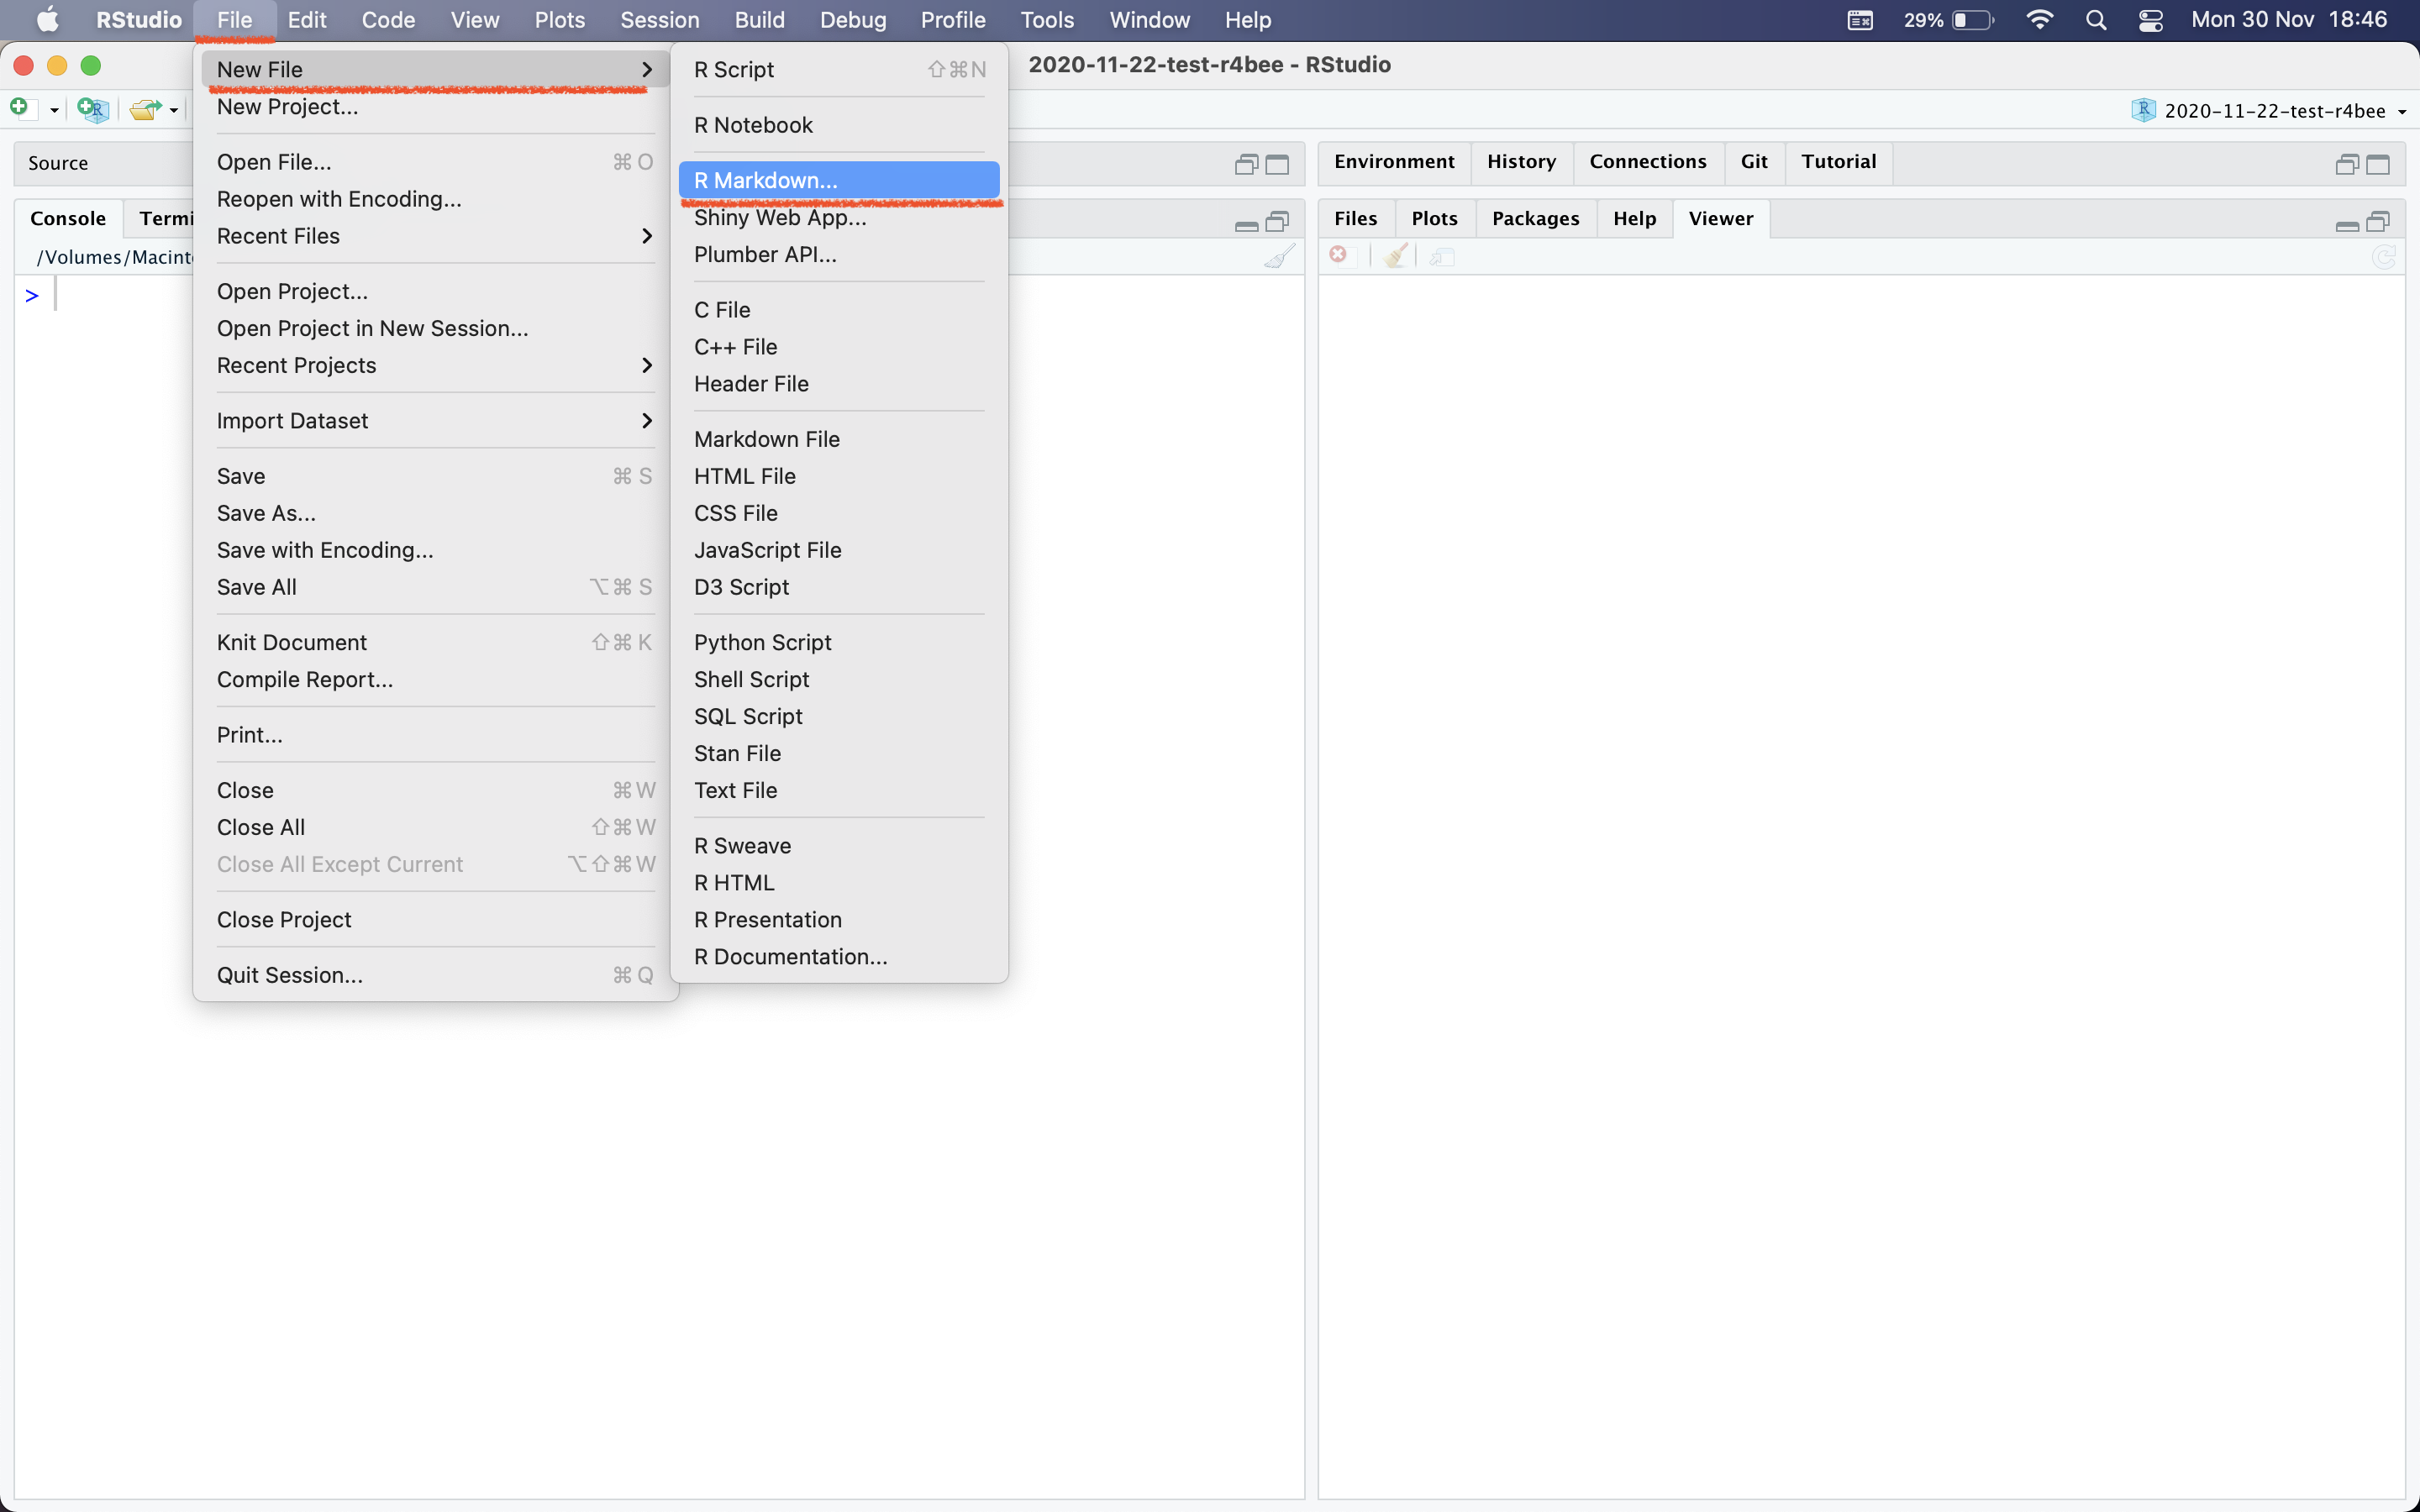
library(palmerpenguins) # to access penguin datalibrary(xaringan)library(xaringanthemer)library(xaringanExtra)File ⟶ New File ⟶ R Markdown

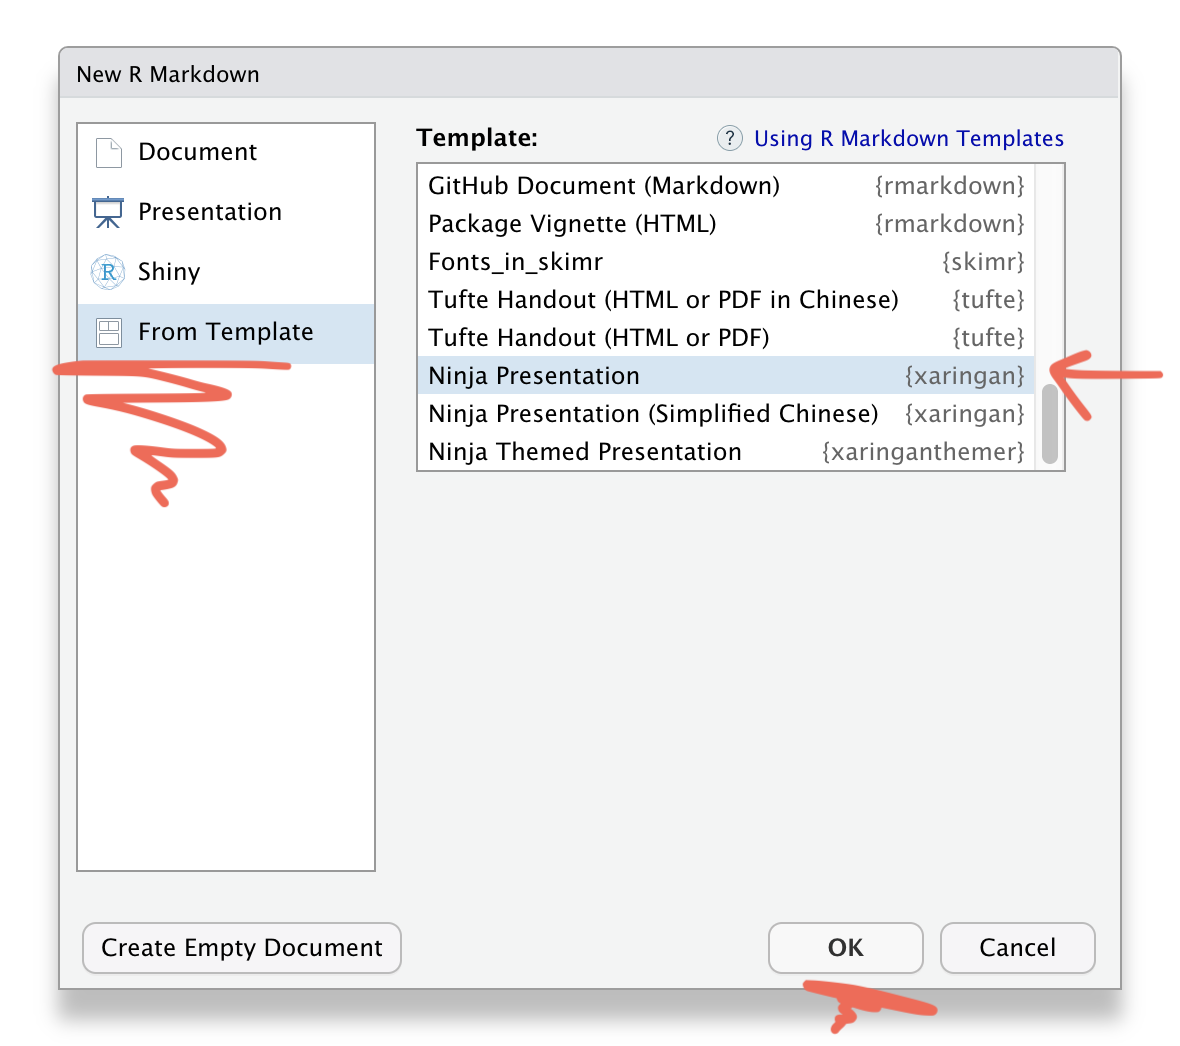
Template → Ninja Presentation

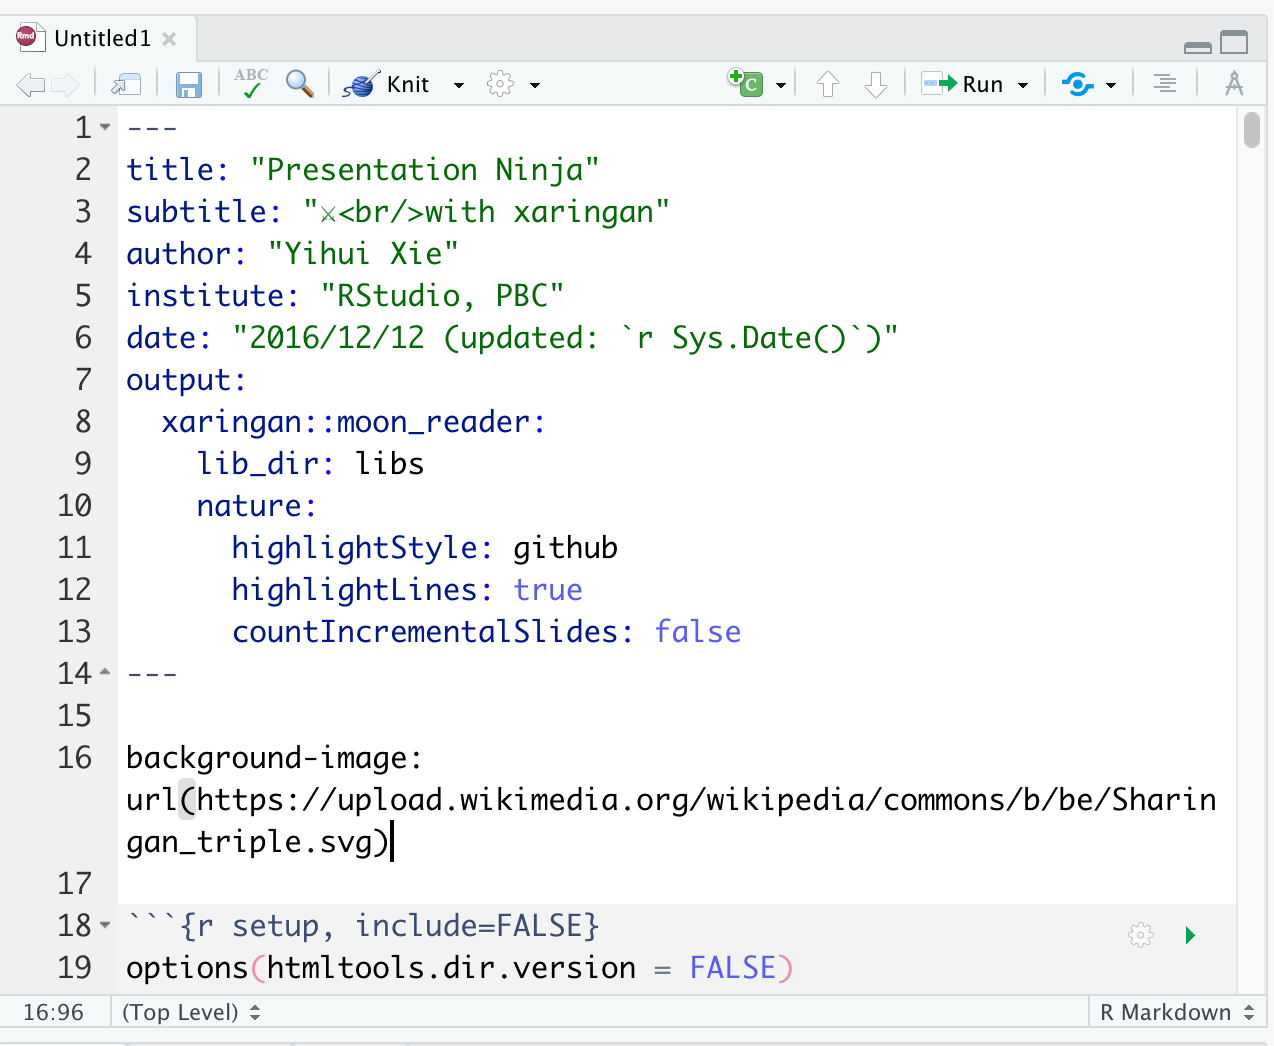
Save this Rmd file

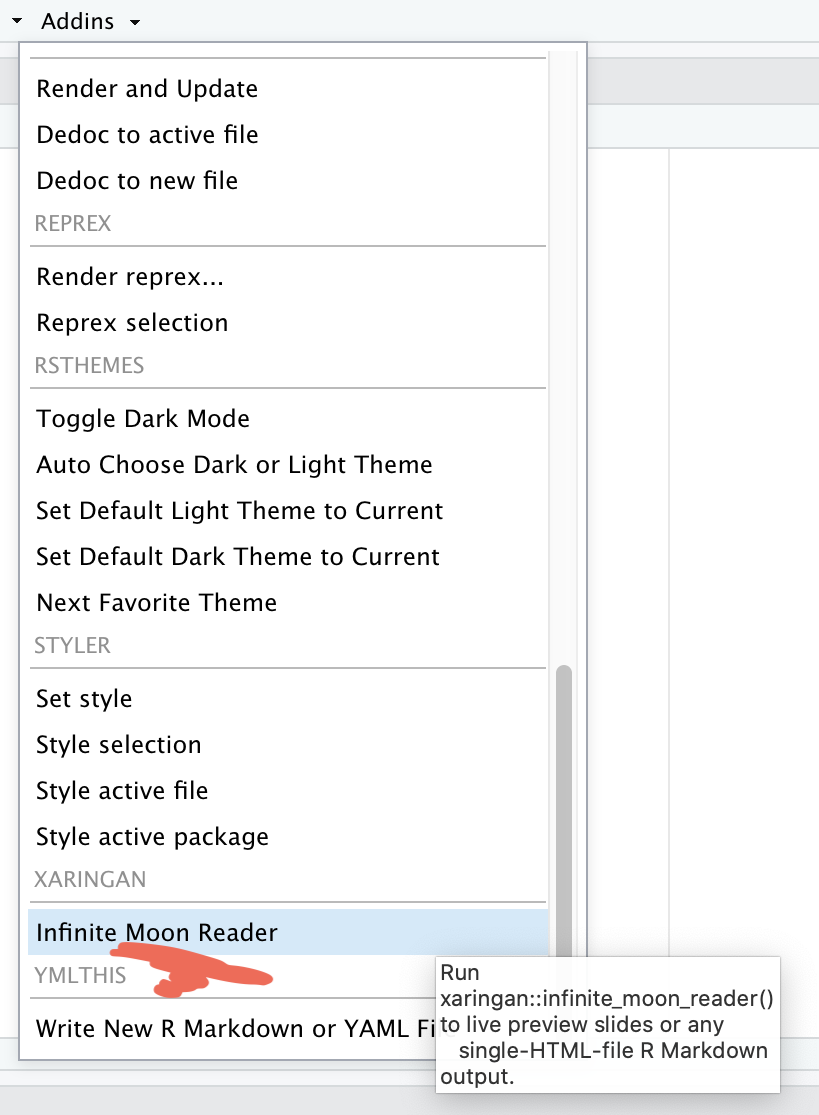
Addins → Inifinite Moon Reader

Addins → Inifinite Moon Reader

xaringan output

Addins → Inifinite Moon Reader

xaringan slide → browser

Addins → Inifinite Moon Reader

xaringan slide → browser

- We need to click
Inifinite Moon Readeronly to start the slideshow. To see the changes made in the slides just save the documentctrl + s
Using xaringan how to:
Using xaringan how to:
- create a new slide
Using xaringan how to:
create a new slide
hide an existing slide
Using xaringan how to:
create a new slide
hide an existing slide
heading, subheadings, points and normal text
Using xaringan how to:
create a new slide
hide an existing slide
heading, subheadings, points and normal text
include images
Using xaringan how to:
create a new slide
hide an existing slide
heading, subheadings, points and normal text
include images
- as background
Using xaringan how to:
create a new slide
hide an existing slide
heading, subheadings, points and normal text
include images
- as background
- as part of slide
Using xaringan how to:
create a new slide
hide an existing slide
heading, subheadings, points and normal text
include images
- as background
- as part of slide
make plots
Using xaringan how to:
create a new slide
hide an existing slide
heading, subheadings, points and normal text
include images
- as background
- as part of slide
make plots
include tables
Using xaringan how to:
create a new slide
hide an existing slide
heading, subheadings, points and normal text
include images
- as background
- as part of slide
make plots
include tables
in-text R output
Using xaringan how to:
create a new slide
hide an existing slide
heading, subheadings, points and normal text
include images
- as background
- as part of slide
make plots
include tables
in-text R output
create columns
- Use
---to create a new slide
Use
---to create a new slideexclude:trueTo hide an existing slide
Use
---to create a new slideexclude:trueTo hide an existing slideSlide text sizes:
Use
---to create a new slideexclude:trueTo hide an existing slideSlide text sizes:
#for main heading
Use
---to create a new slideexclude:trueTo hide an existing slideSlide text sizes:
#for main heading##for sub-heading
Use
---to create a new slideexclude:trueTo hide an existing slideSlide text sizes:
#for main heading##for sub-heading####for sub-sub-heading
Use
---to create a new slideexclude:trueTo hide an existing slideSlide text sizes:
#for main heading##for sub-heading####for sub-sub-heading
- indented
*for sub-point1 - indented
*for sub-point2 - indented
*for sub-point3
Use
---to create a new slideexclude:trueTo hide an existing slideSlide text sizes:
#for main heading##for sub-heading####for sub-sub-heading
- indented
*for sub-point1 - indented
*for sub-point2 - indented
*for sub-point3
-for normal text size
To include images using:
CSS background option:
To include images using:
CSS background option:
background-image: url("path of the image")= path of the image
To include images using:
CSS background option:
background-image: url("path of the image")= path of the imagebackground-size: contain, cover, 50%, 70%= size of the image
To include images using:
CSS background option:
background-image: url("path of the image")= path of the imagebackground-size: contain, cover, 50%, 70%= size of the imagebackground-position: left top= position of the image
To include images using:
knitr chunk option:
knitr::include_graphics("path of the image")To include plots
library(palmerpenguins)ggplot(penguins, aes(x = species)) + geom_bar()To include tables
library(kableExtra)library(tidyverse)penguins %>% drop_na() %>% head() %>% kable()| species | island | bill_length_mm | bill_depth_mm | flipper_length_mm | body_mass_g | sex | year |
|---|---|---|---|---|---|---|---|
| Adelie | Torgersen | 39.1 | 18.7 | 181 | 3750 | male | 2007 |
| Adelie | Torgersen | 39.5 | 17.4 | 186 | 3800 | female | 2007 |
| Adelie | Torgersen | 40.3 | 18.0 | 195 | 3250 | female | 2007 |
| Adelie | Torgersen | 36.7 | 19.3 | 193 | 3450 | female | 2007 |
| Adelie | Torgersen | 39.3 | 20.6 | 190 | 3650 | male | 2007 |
| Adelie | Torgersen | 38.9 | 17.8 | 181 | 3625 | female | 2007 |
In-text R output
- penguins data have a sample of n = 344 on total 8 variables.
In-text R output
penguins data have a sample of n = 344 on total 8 variables.
math expressions
a+b=σ−∑x22
Column division of slide
- left column
a
- b
- c
- right column
- apple
- boy
- cat
Slide class
- class can be assigned to each slide
Slide class
class can be assigned to each slide
it decides how all elements of one particular slide will look like
Slide class
class can be assigned to each slide
it decides how all elements of one particular slide will look like
class: center
Slide class
class can be assigned to each slide
it decides how all elements of one particular slide will look like
class: center, middle, inverse, right
Extend the power of xaringan:
Extend the power of xaringan:
using R packages like xaringanExtra
learn little about CSS
use cheatsheets
