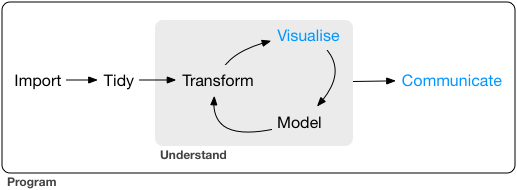
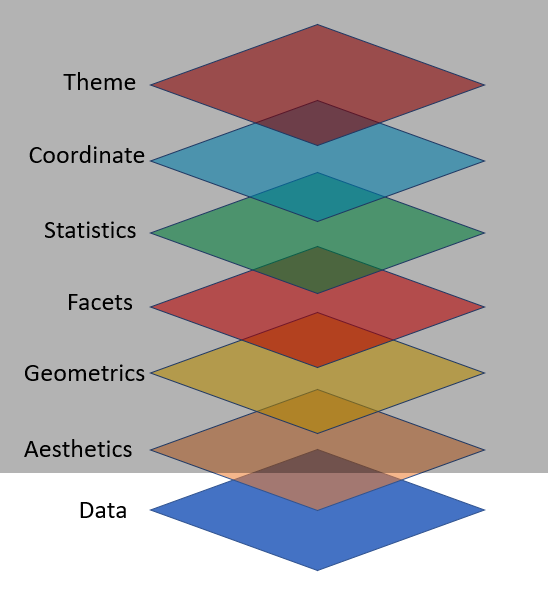
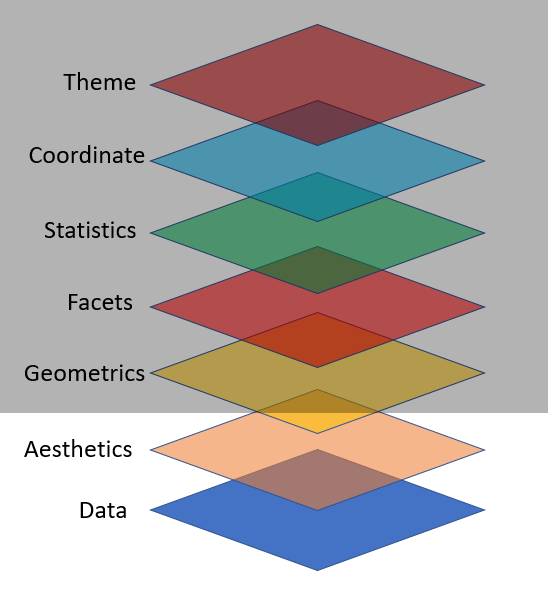
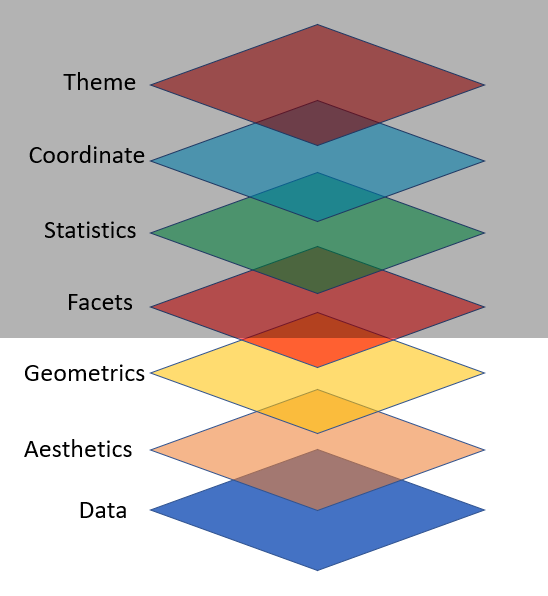
Course Progress

Variable types in R:
Variable types in R:
intstands for integers, like 4, 55, 300.
Variable types in R:
intstands for integers, like 4, 55, 300.dblstands for doubles, or real numbers like 3, 7.45, 1.565, 12.
Variable types in R:
intstands for integers, like 4, 55, 300.dblstands for doubles, or real numbers like 3, 7.45, 1.565, 12.chrstands for character vectors, or strings like names.
Variable types in R:
intstands for integers, like 4, 55, 300.dblstands for doubles, or real numbers like 3, 7.45, 1.565, 12.chrstands for character vectors, or strings like names.dttmstands for date-times (a date + a time).
Variable types in R:
intstands for integers, like 4, 55, 300.dblstands for doubles, or real numbers like 3, 7.45, 1.565, 12.chrstands for character vectors, or strings like names.dttmstands for date-times (a date + a time).lglstands for logical, vectors that contain only TRUE or FALSE.
Variable types in R:
intstands for integers, like 4, 55, 300.dblstands for doubles, or real numbers like 3, 7.45, 1.565, 12.chrstands for character vectors, or strings like names.dttmstands for date-times (a date + a time).lglstands for logical, vectors that contain only TRUE or FALSE.fctstands for factors, which R uses to represent categorical variables with fixed possible values like occupation: student, professional, government, business.
Variable types in R:
intstands for integers, like 4, 55, 300.dblstands for doubles, or real numbers like 3, 7.45, 1.565, 12.chrstands for character vectors, or strings like names.dttmstands for date-times (a date + a time).lglstands for logical, vectors that contain only TRUE or FALSE.fctstands for factors, which R uses to represent categorical variables with fixed possible values like occupation: student, professional, government, business.datestands for dates.
Data of Palmer Penguins
- It comes with R package
palmerpenguins
Data of Palmer Penguins
It comes with R package
palmerpenguinsName of the data is
penguins
Data of Palmer Penguins
It comes with R package
palmerpenguinsName of the data is
penguinsTo know more about the data
?penguins
Data of Palmer Penguins
It comes with R package
palmerpenguinsName of the data is
penguinsTo know more about the data
?penguinsIncluded variables are:
- species, island, bill_length_mm, bill_depth_mm, flipper_length_mm, body_mass_g, sex, year
An Overview of Data
glimpse(penguins)## Rows: 344## Columns: 8## $ species <fct> Adelie, Adelie, Adelie, Adelie, Adelie, Adelie, Adel…## $ island <fct> Torgersen, Torgersen, Torgersen, Torgersen, Torgerse…## $ bill_length_mm <dbl> 39.1, 39.5, 40.3, NA, 36.7, 39.3, 38.9, 39.2, 34.1, …## $ bill_depth_mm <dbl> 18.7, 17.4, 18.0, NA, 19.3, 20.6, 17.8, 19.6, 18.1, …## $ flipper_length_mm <int> 181, 186, 195, NA, 193, 190, 181, 195, 193, 190, 186…## $ body_mass_g <int> 3750, 3800, 3250, NA, 3450, 3650, 3625, 4675, 3475, …## $ sex <fct> male, female, female, NA, female, male, female, male…## $ year <int> 2007, 2007, 2007, 2007, 2007, 2007, 2007, 2007, 2007…An Overview of Data
summary(penguins)## species island bill_length_mm bill_depth_mm ## Adelie :152 Biscoe :168 Min. :32.10 Min. :13.10 ## Chinstrap: 68 Dream :124 1st Qu.:39.23 1st Qu.:15.60 ## Gentoo :124 Torgersen: 52 Median :44.45 Median :17.30 ## Mean :43.92 Mean :17.15 ## 3rd Qu.:48.50 3rd Qu.:18.70 ## Max. :59.60 Max. :21.50 ## NA's :2 NA's :2 ## flipper_length_mm body_mass_g sex year ## Min. :172.0 Min. :2700 female:165 Min. :2007 ## 1st Qu.:190.0 1st Qu.:3550 male :168 1st Qu.:2007 ## Median :197.0 Median :4050 NA's : 11 Median :2008 ## Mean :200.9 Mean :4202 Mean :2008 ## 3rd Qu.:213.0 3rd Qu.:4750 3rd Qu.:2009 ## Max. :231.0 Max. :6300 Max. :2009 ## NA's :2 NA's :2Packages required:
library(palmerpenguins) # to access penguin datalibrary(tidyverse) # to use ggplot2 pkg- Packages recommended:
install.packages(c( "directlabels", "dplyr", "gameofthrones", "ggforce", "gghighlight", "ggnewscale", "ggplot2", "ggraph", "ggrepel", "ggtext", "ggthemes", "hexbin", "mapproj", "maps", "munsell", "ozmaps", "paletteer", "patchwork", "rmapshaper", "scico", "seriation", "sf", "stars", "tidygraph", "tidyr", "wesanderson" ))R
Package
ggplot2 by Hadley Wickham
- "is a system for declaratively creating graphics, based on The Grammar of Graphics" (book by Late Leland Wilkinson)

Late Leland Wilkinson

Hadley Wickham
Key Components for ggplot2 Plot
data,
aesthetic mapping
at least one layer of geom function
How to export plot to your computer?
How to add color to bars?
How to add color using palette? 🎨
🎨 Color Palette
- R package
RColorBrewer&wesanderson

How to remove legend or change its position?
How to plot title and axis titles?
How to control size of text?
ggplot(data = penguins, mapping = aes(x = species, fill = species)) + geom_bar() + scale_fill_brewer(palette = "Dark2") + theme(legend.position = "none", text = element_text(size = 20)) + labs( title = "Species of palmer penguins", subtitle = "This data is about penguins", x = "Species", y = "Frequency" )
How to plot two numeric variables?
ggplot(data = penguins, mapping = aes(x = bill_length_mm, y = bill_depth_mm, color = species)) + geom_point() + scale_fill_brewer(palette = "Dark2") + theme(legend.position = "none", text = element_text(size = 20)) + labs( title = "Relationship between bill length \n& depth of palmer penguins", subtitle = "This data is about penguins", x = "Bill length (mm)", y = "Bith depth (mm)" )
How to add themes to ggplot?
ggplot2 themes
https://ggplot2.tidyverse.org/reference/ggtheme.html
theme_gray()
theme_bw()
theme_linedraw()
theme_light()
theme_dark()
theme_minimal()
theme_classic()
theme_void()
theme_test()
ggplot(data = penguins, mapping = aes(x = bill_length_mm, y = bill_depth_mm, color = species)) + geom_point() + scale_fill_brewer(palette = "Dark2") + theme(legend.position = "none", text = element_text(size = 20)) + labs( title = "Relationship between bill length \n& depth of palmer penguins", subtitle = "This data is about penguins", x = "Bill length (mm)", y = "Bith depth (mm)" ) + theme_bw()
ggplot(data = penguins, mapping = aes(x = bill_length_mm, y = bill_depth_mm, color = species)) + geom_point() + scale_fill_brewer(palette = "Dark2") + theme(legend.position = "none", text = element_text(size = 20)) + labs( title = "Relationship between bill length \n& depth of palmer penguins", subtitle = "This data is about penguins", x = "Bill length (mm)", y = "Bith depth (mm)" ) + theme_classic()
How to add regression line to ggplot?
ggplot(data = penguins, mapping = aes(x = flipper_length_mm, y = body_mass_g)) + geom_point() + theme(legend.position = "none", text = element_text(size = 24)) + labs( title = "Relationship between bill length \n& depth of palmer penguins", subtitle = "This data is about penguins", x = "Flipper length (mm)", y = "Body mass (gm)" ) + theme_classic() + geom_smooth()
More resources
ggplot2 book https://ggplot2-book.org/
CÉDRIC SCHERER https://www.cedricscherer.com/
ggplot2 cook book http://www.cookbook-r.com/


