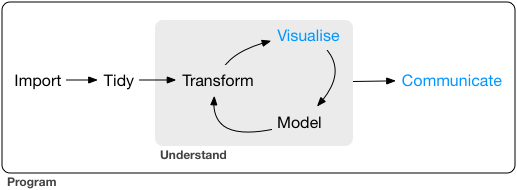
Course Progress
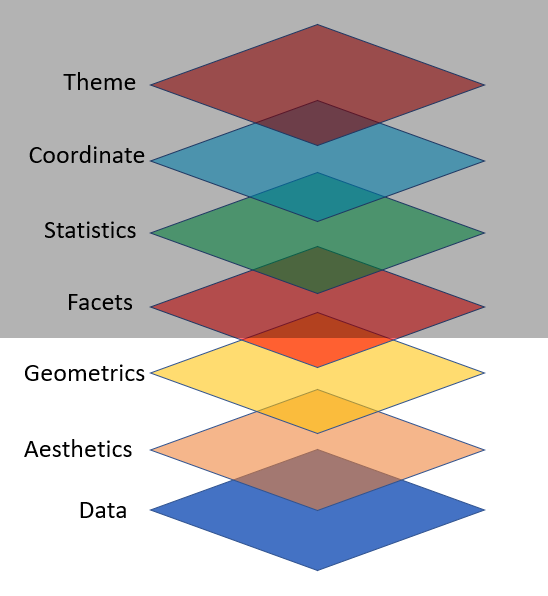
ggplot2 by Hadley Wickham
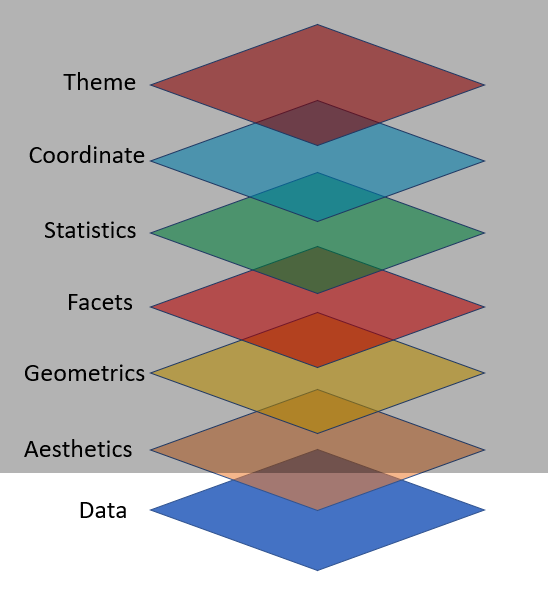
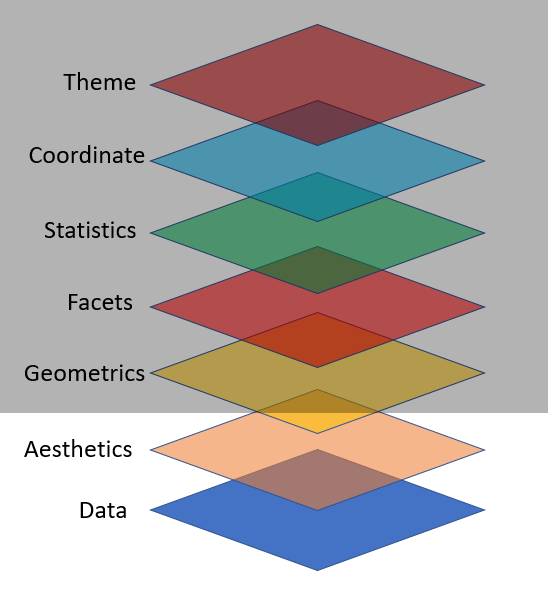
- "is a system for declaratively creating graphics, based on The Grammar of Graphics" (book by Late Leland Wilkinson)

Late Leland Wilkinson

Hadley Wickham


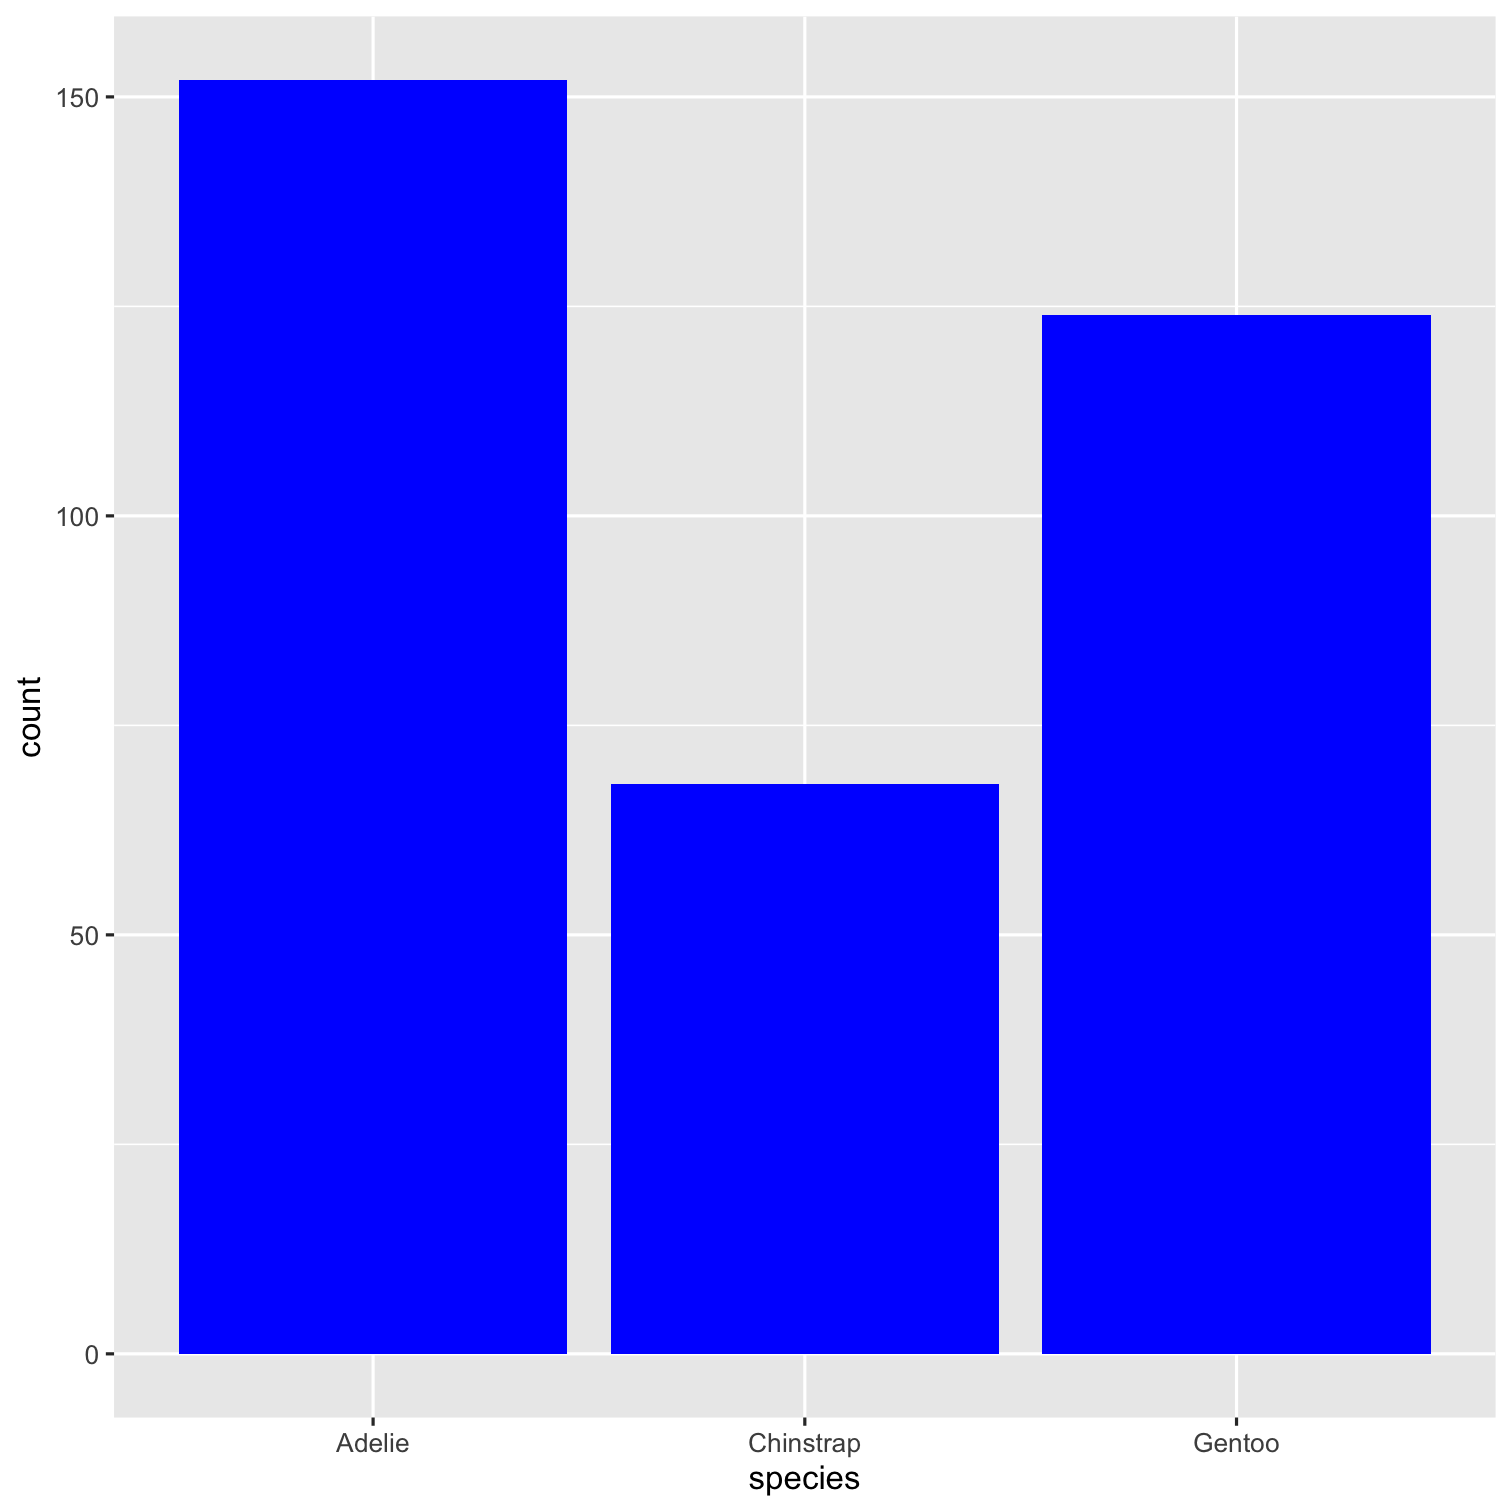
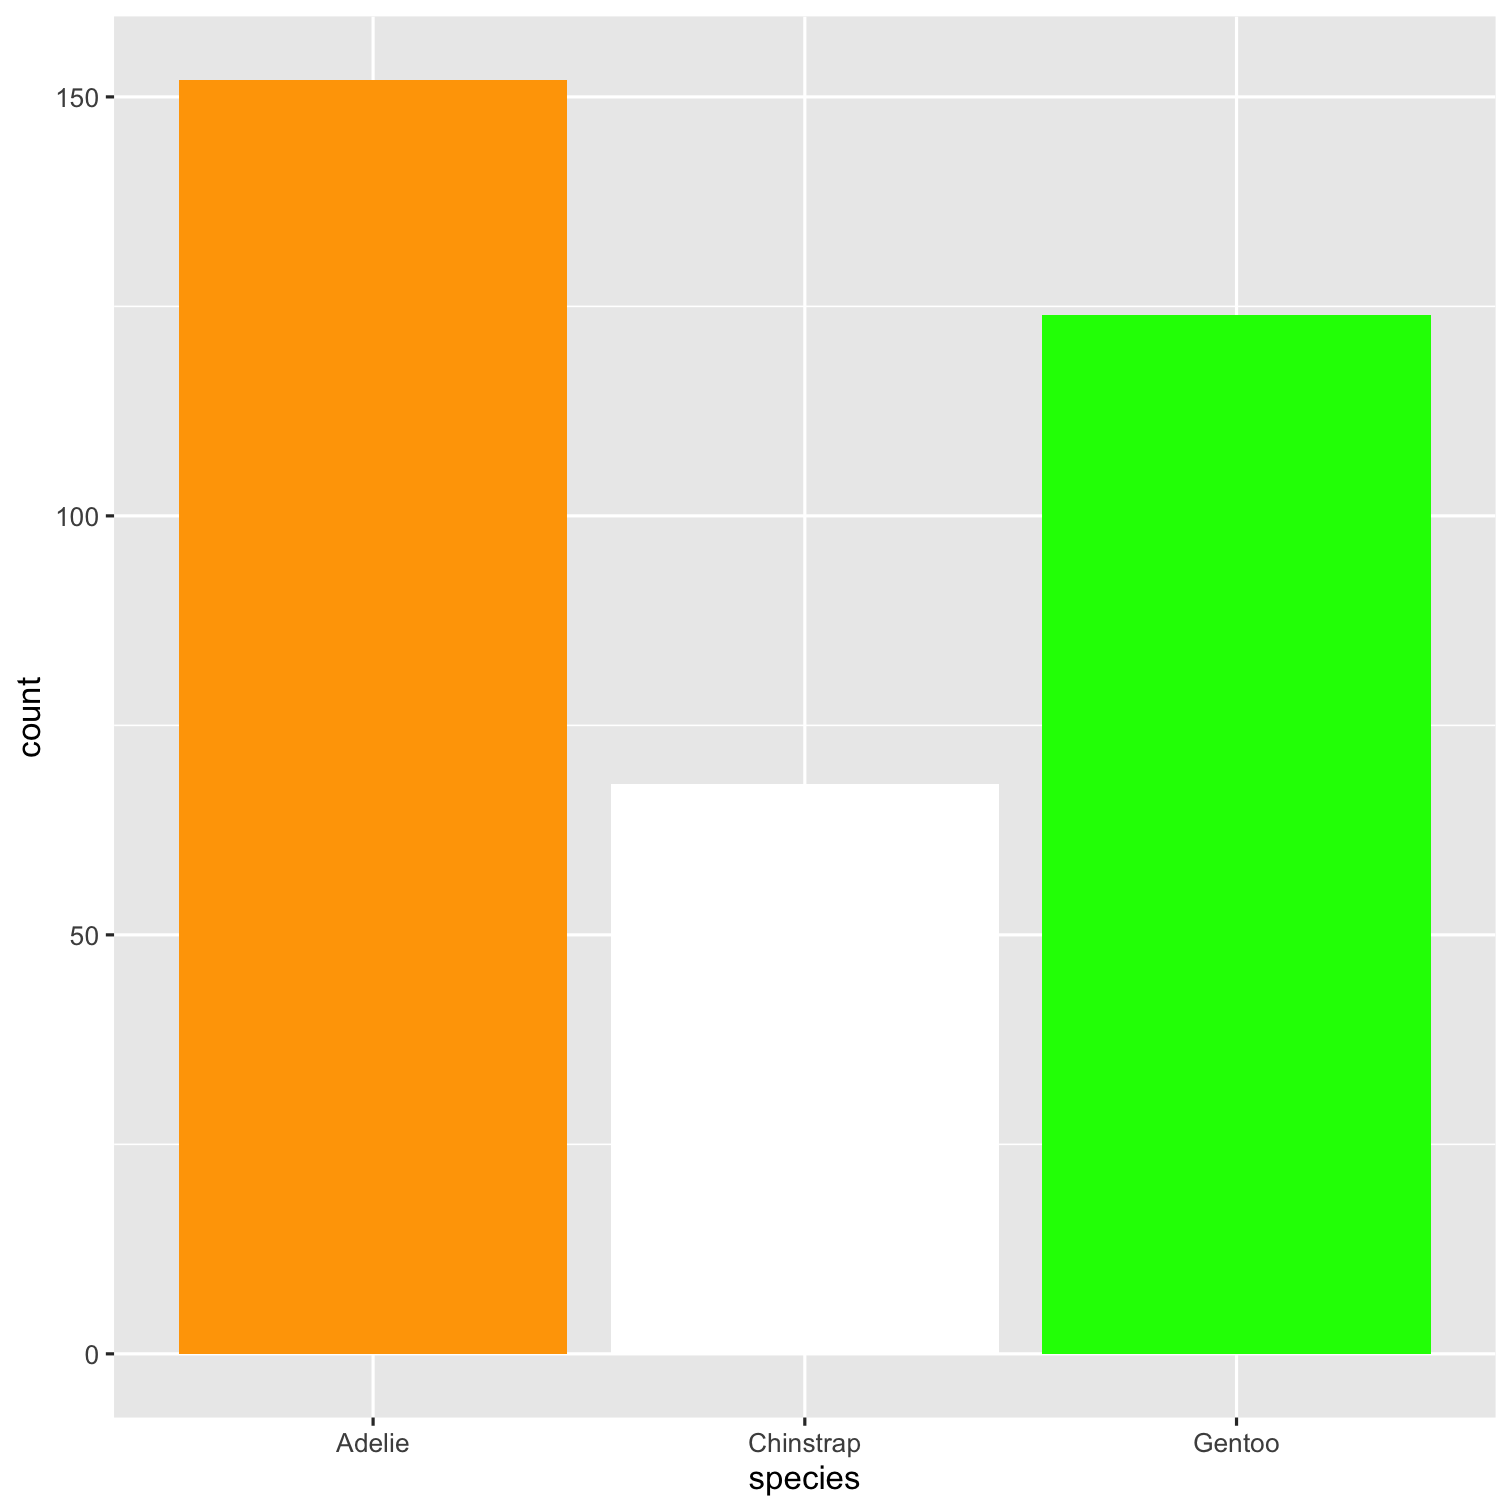
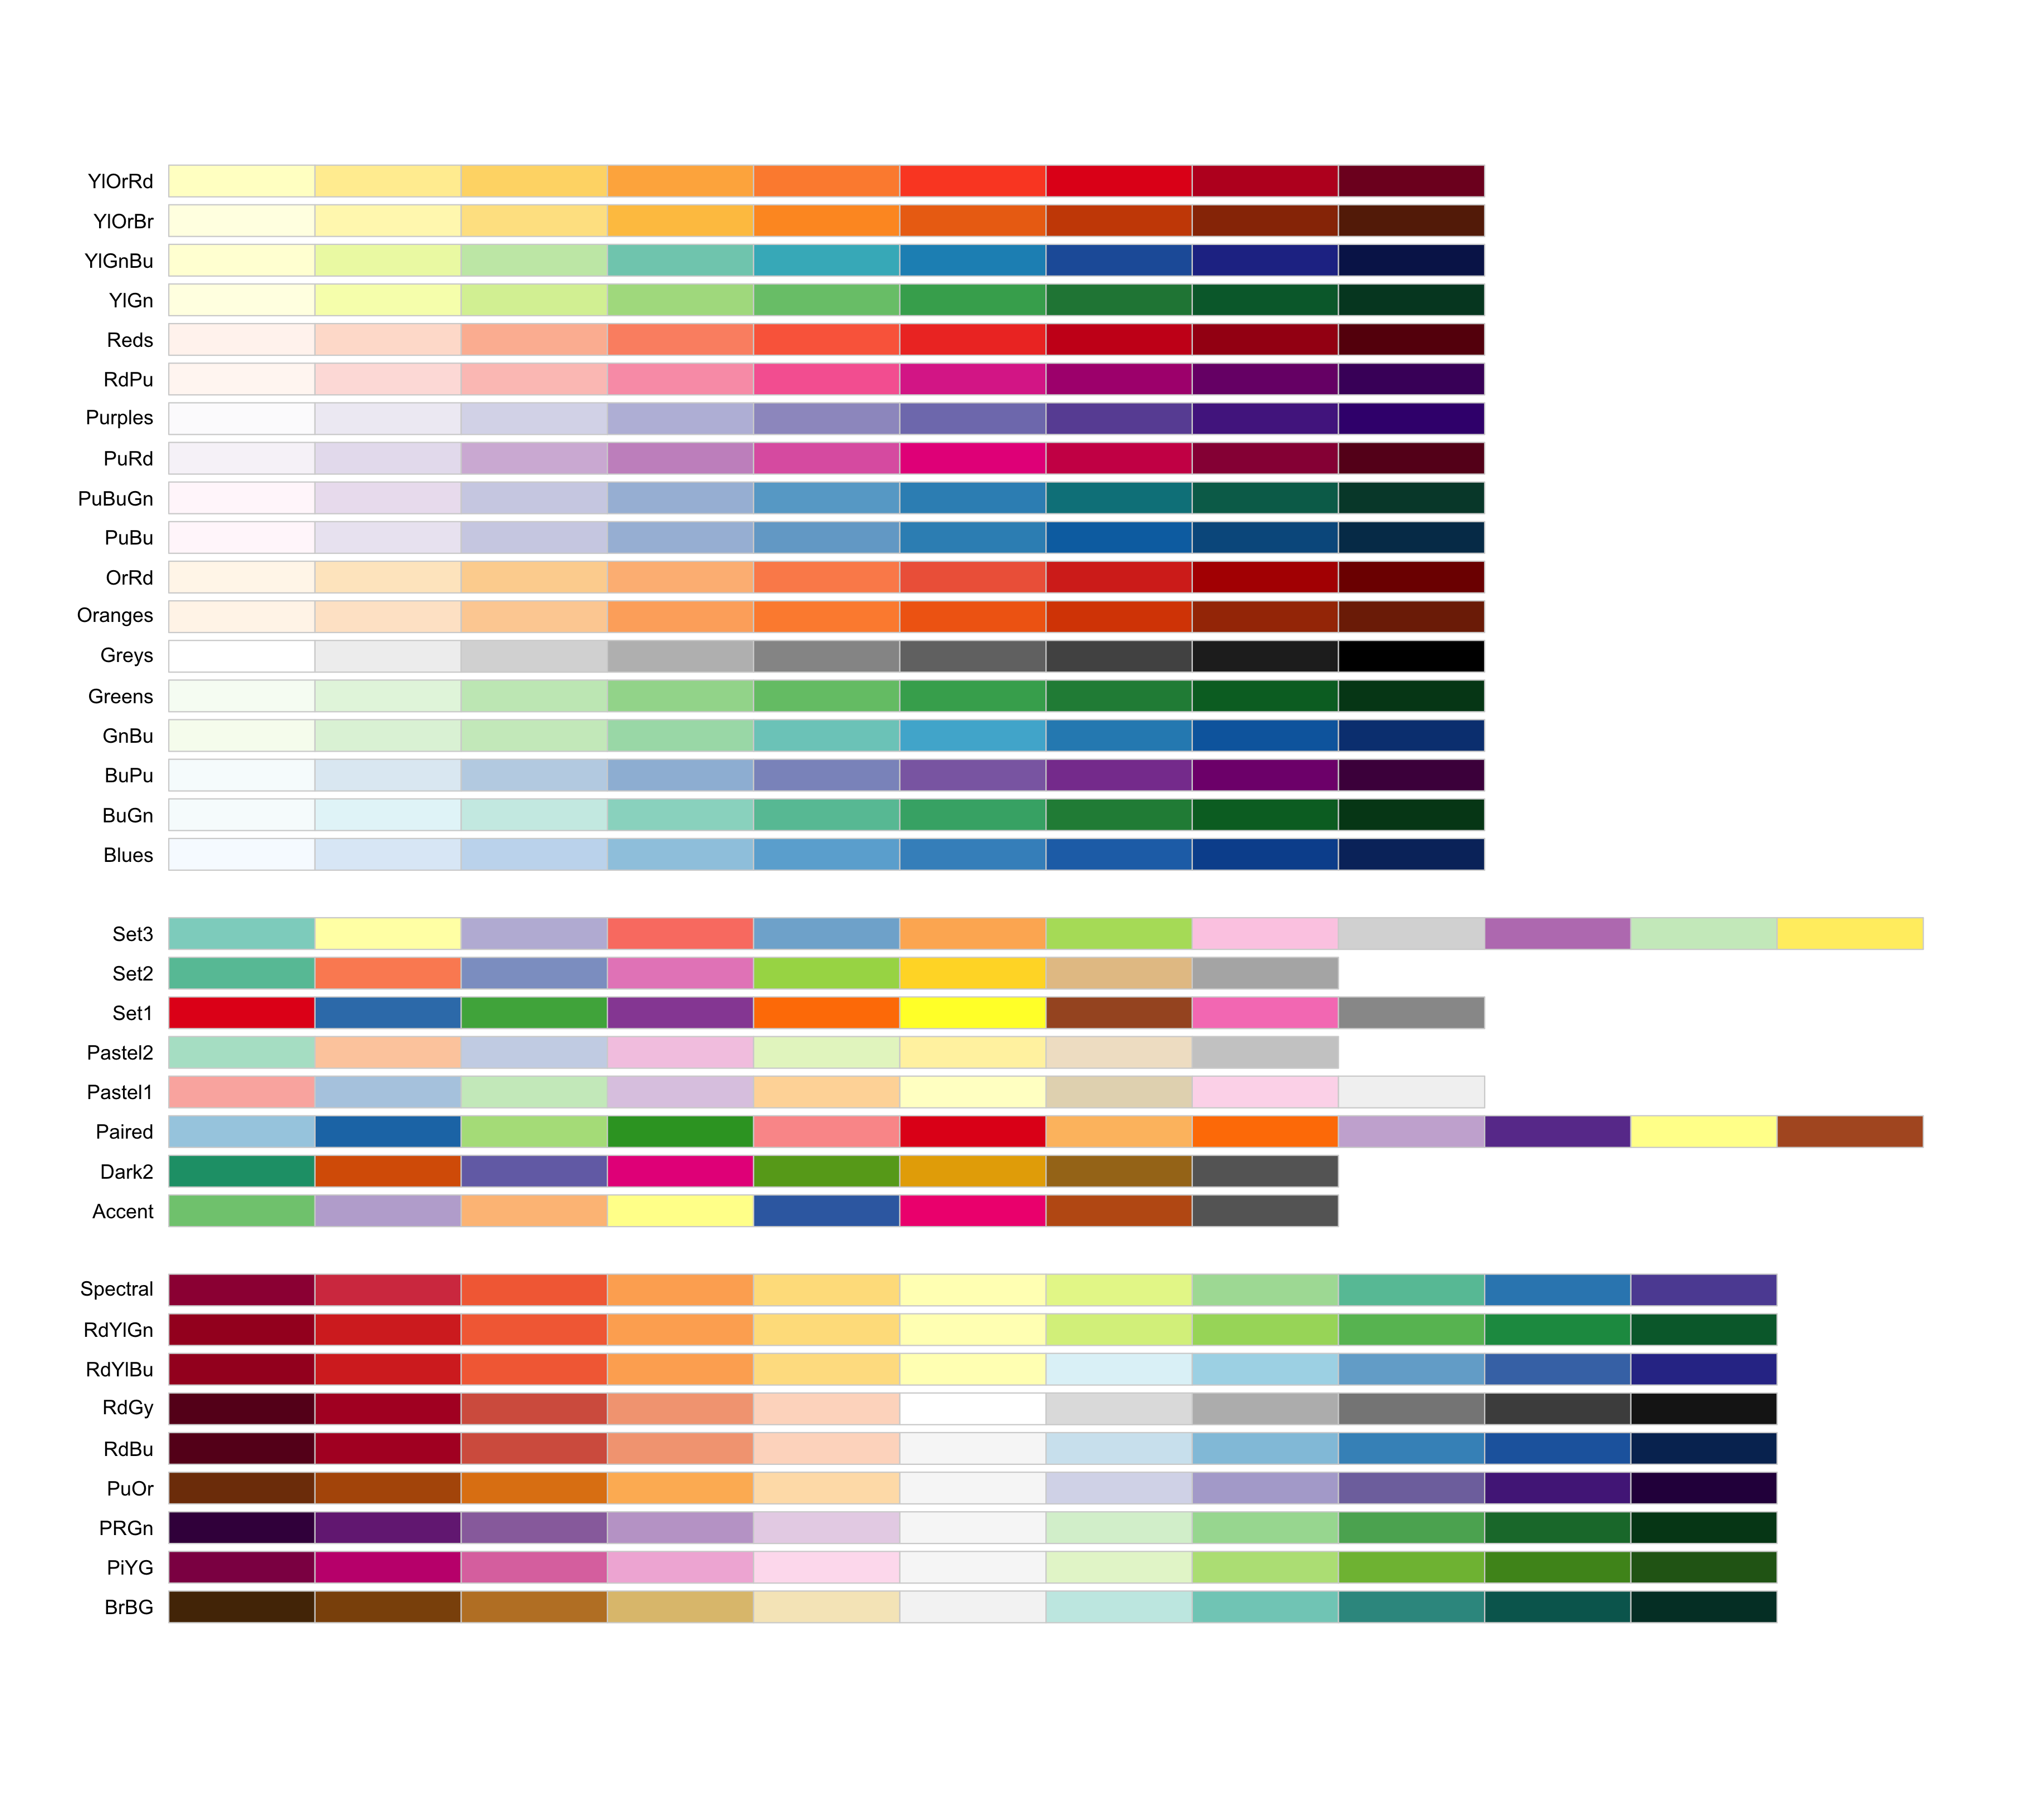
🎨 Color Palette
- R package
RColorBrewer&wesanderson
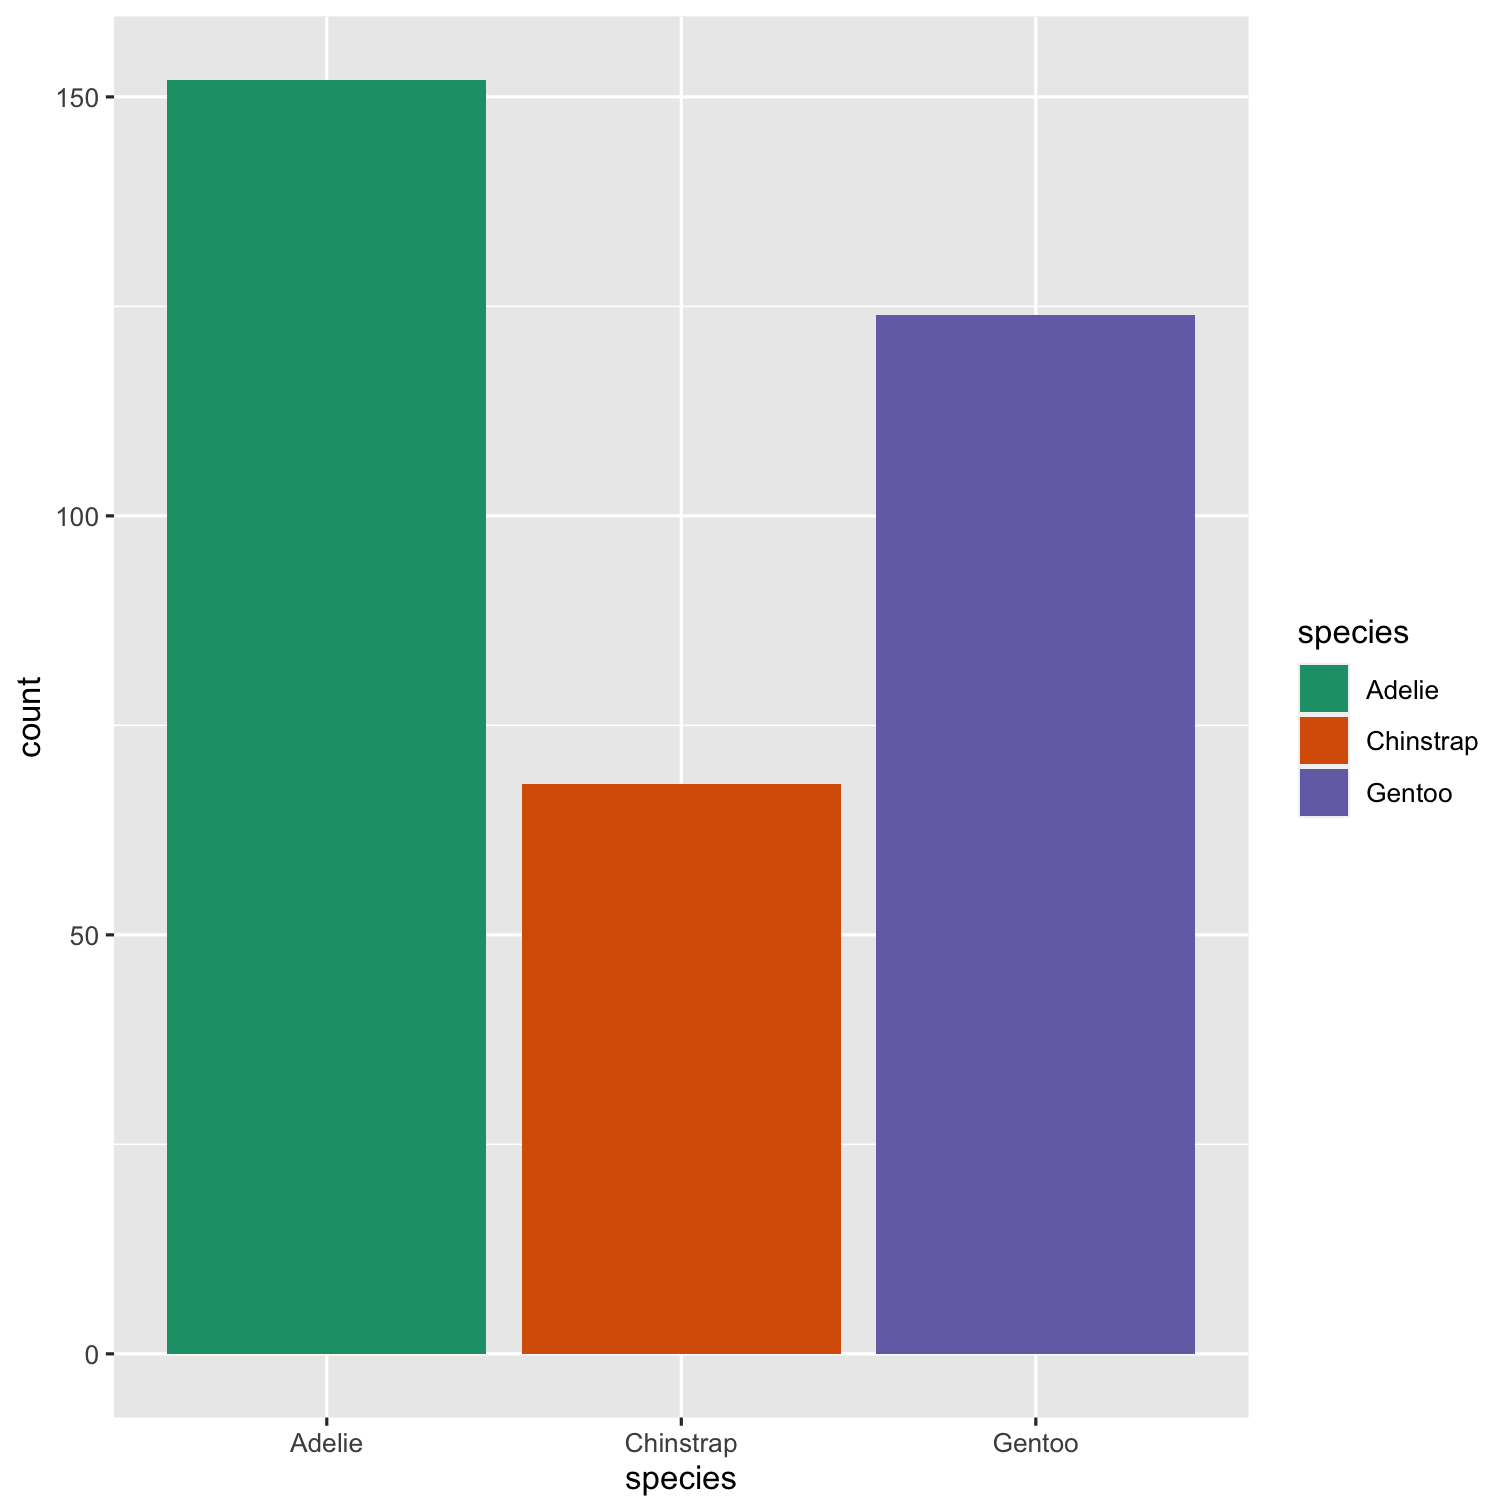
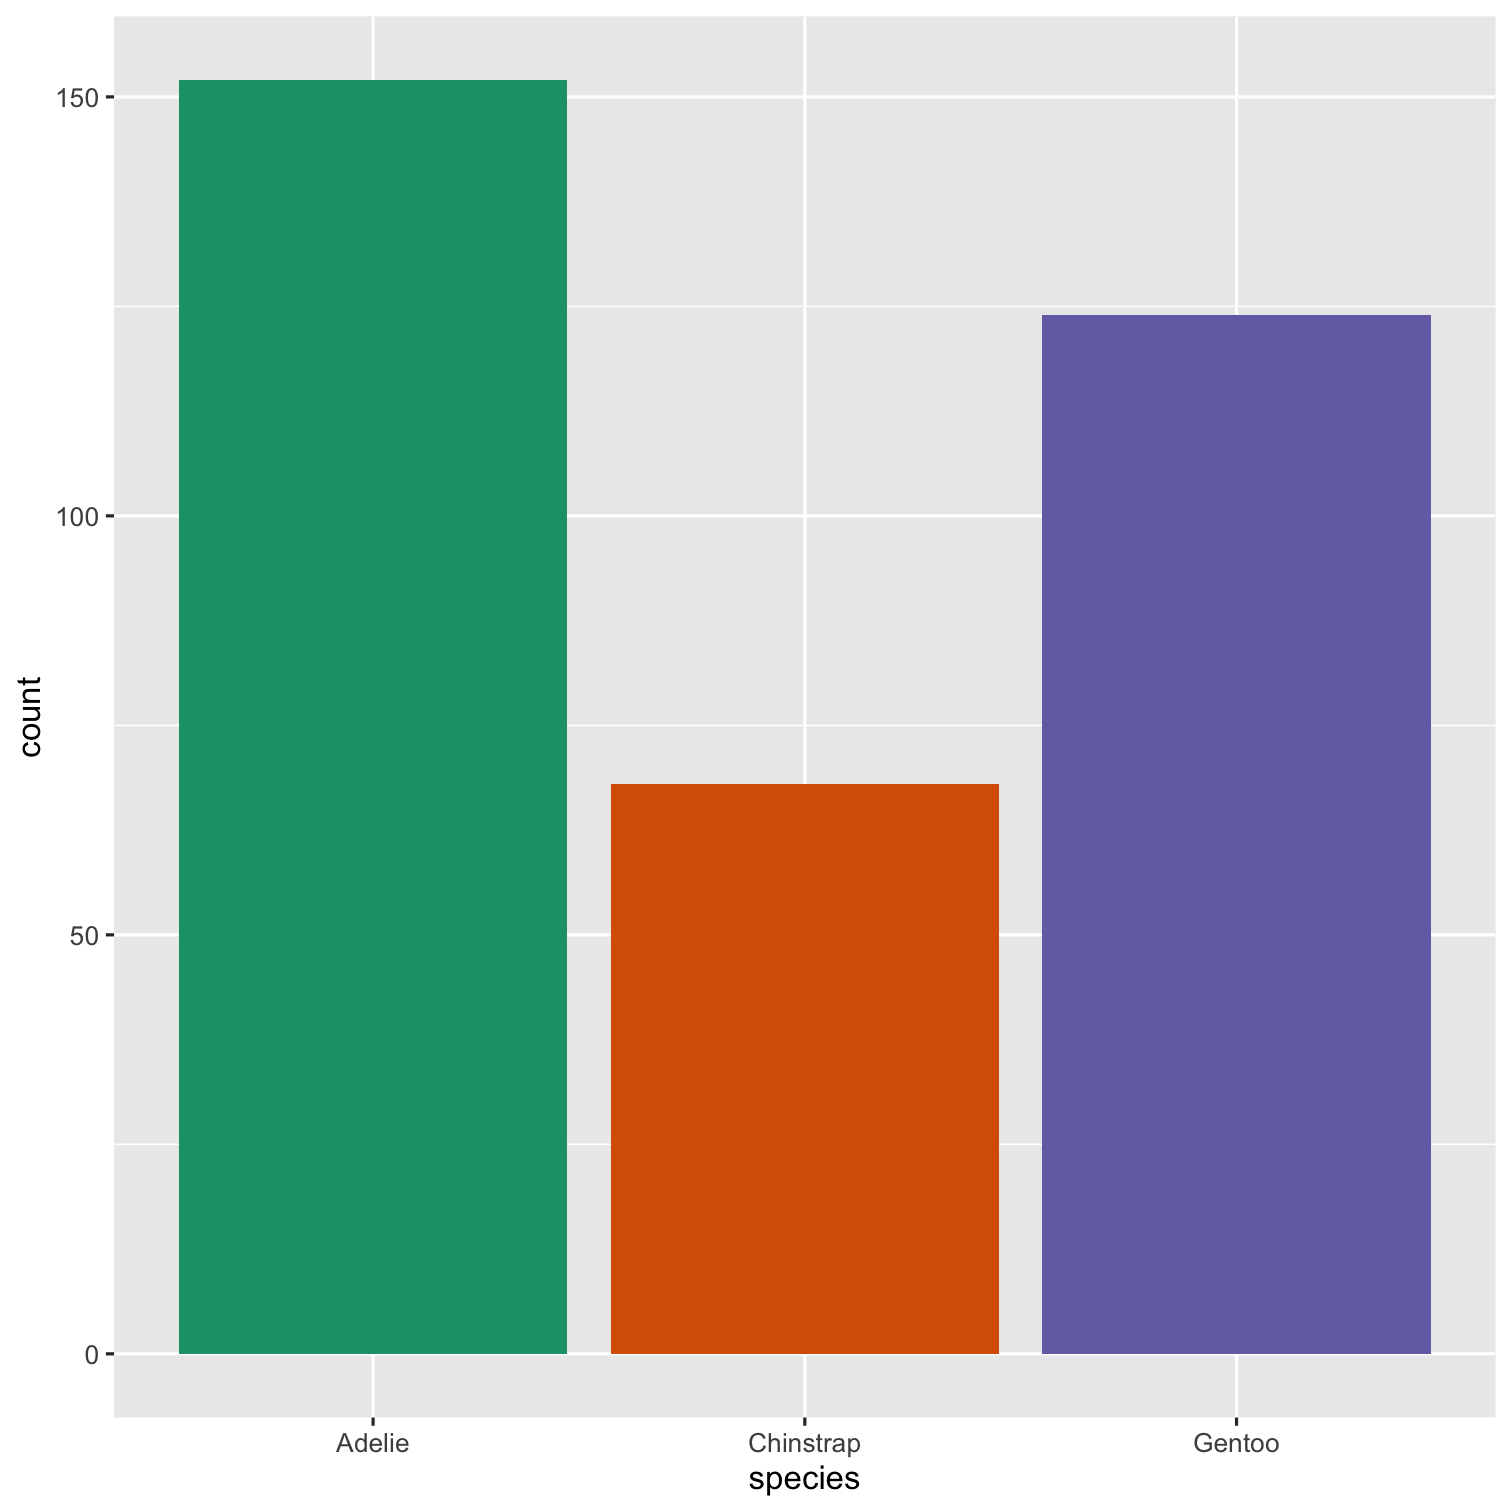
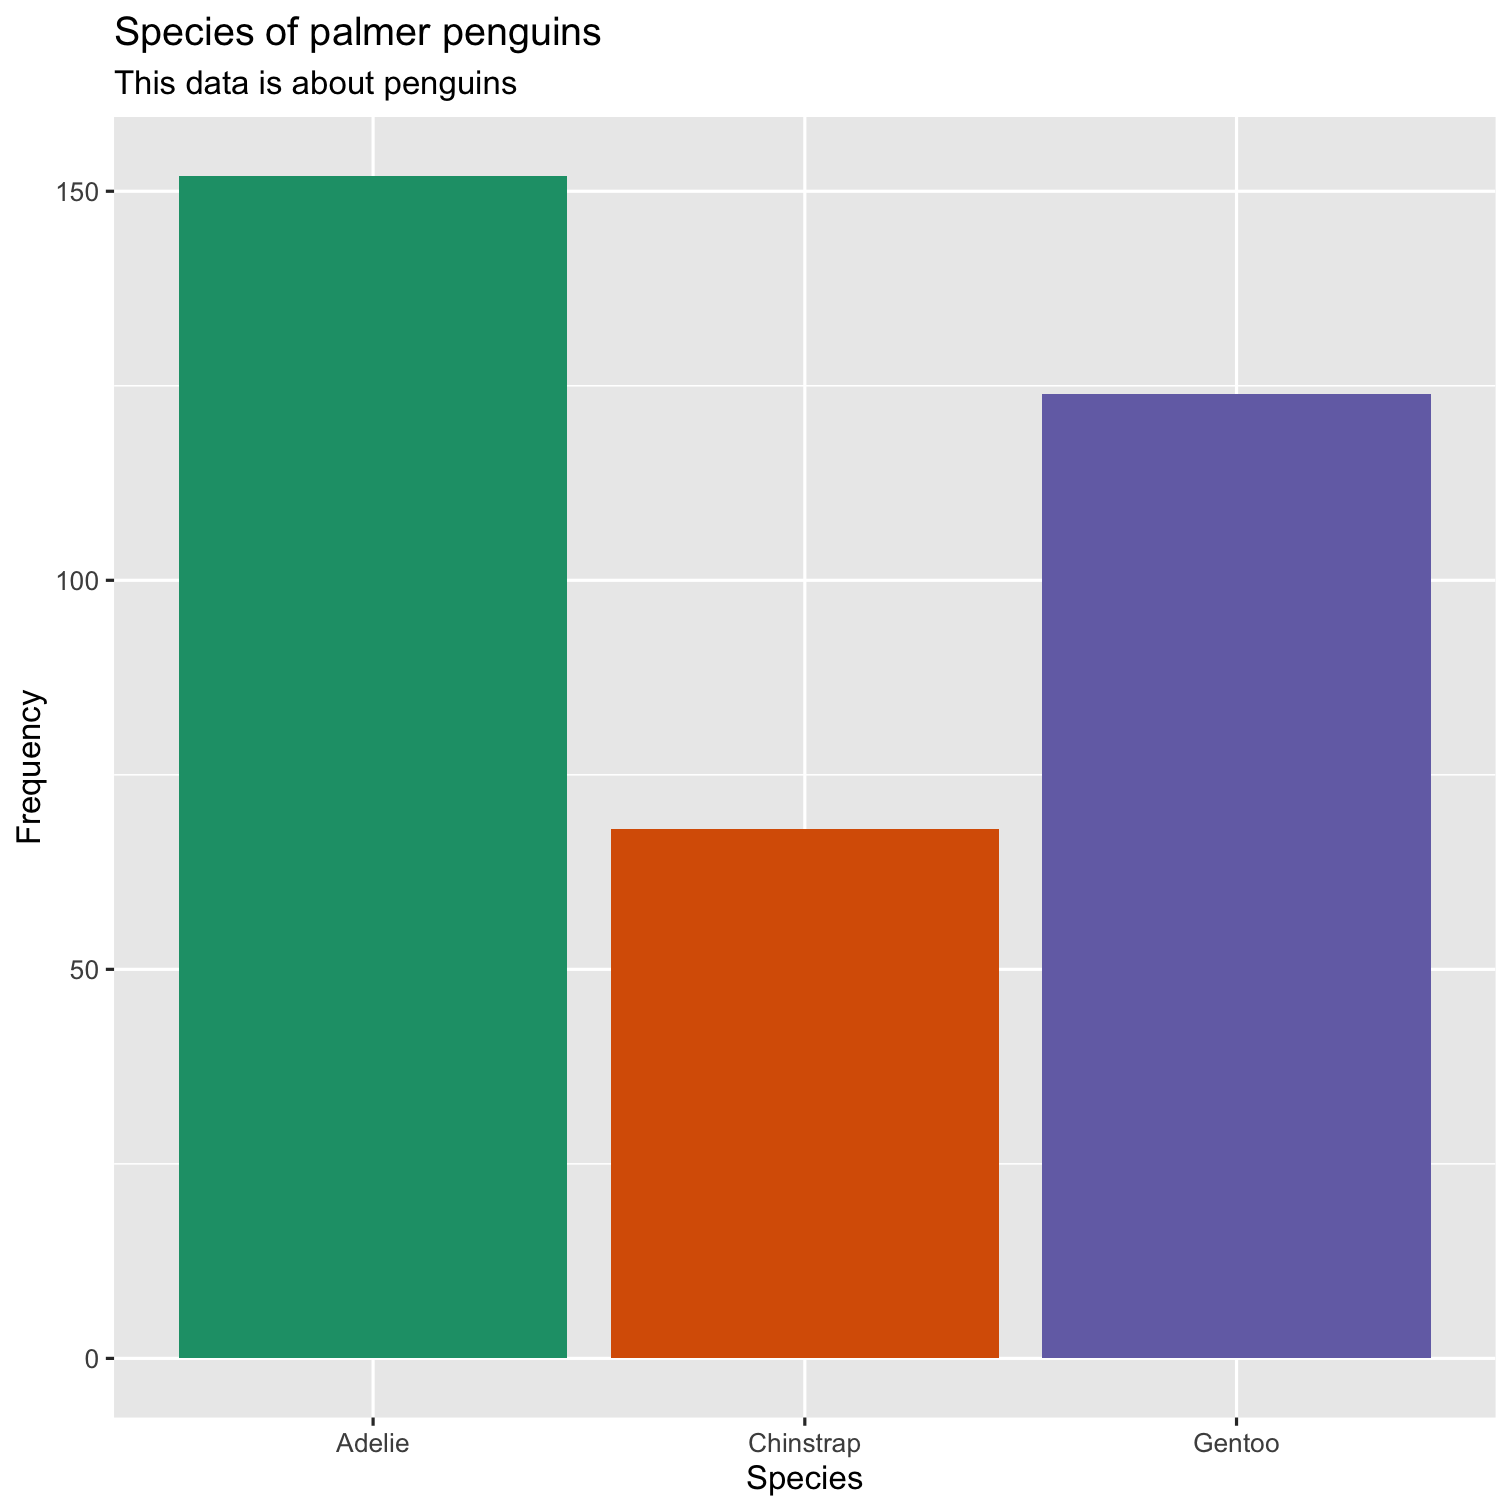
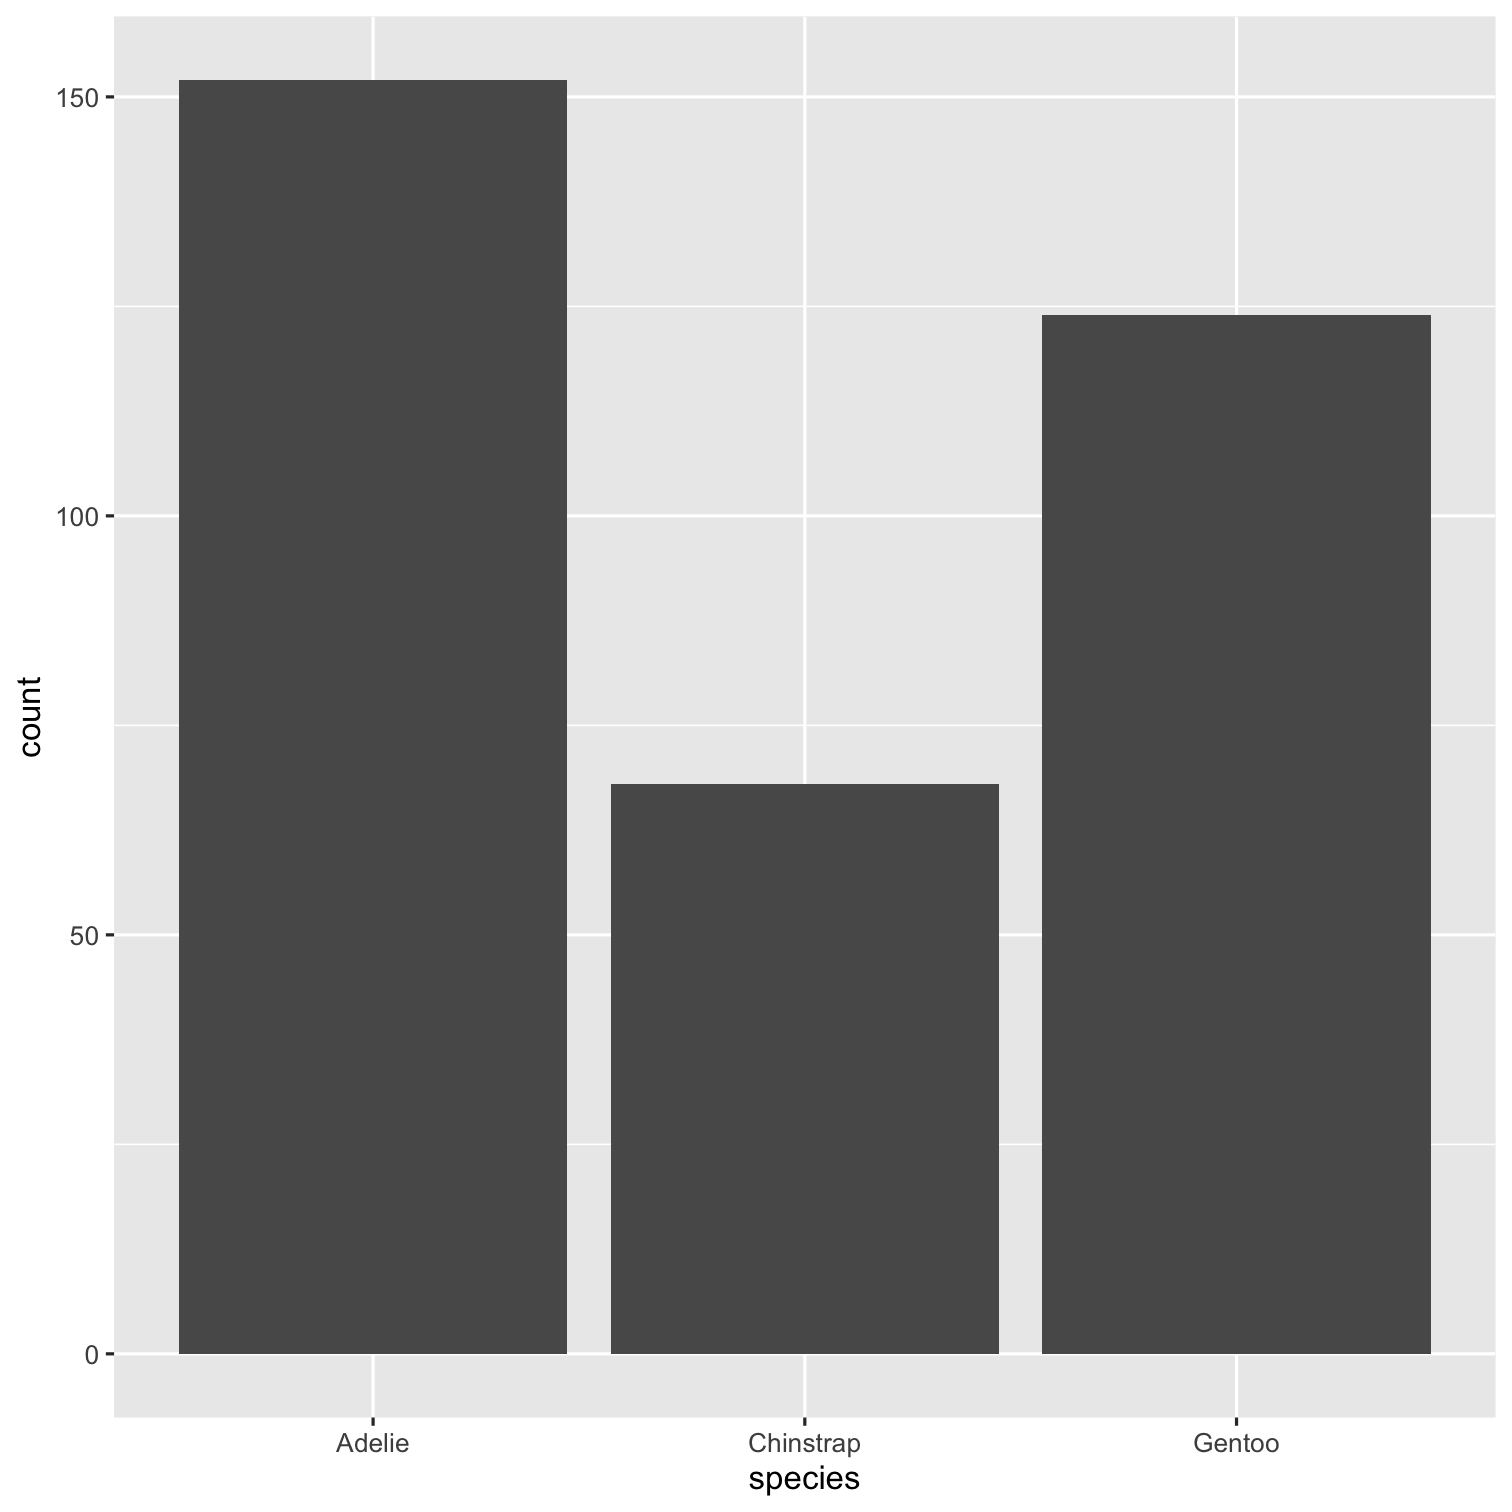
ggplot(data = penguins, mapping = aes(x = species, fill = species)) + geom_bar() + scale_fill_brewer(palette = "Dark2") + theme(legend.position = "none", text = element_text(size = 20)) + labs( title = "Species of palmer penguins", subtitle = "This data is about penguins", x = "Species", y = "Frequency" )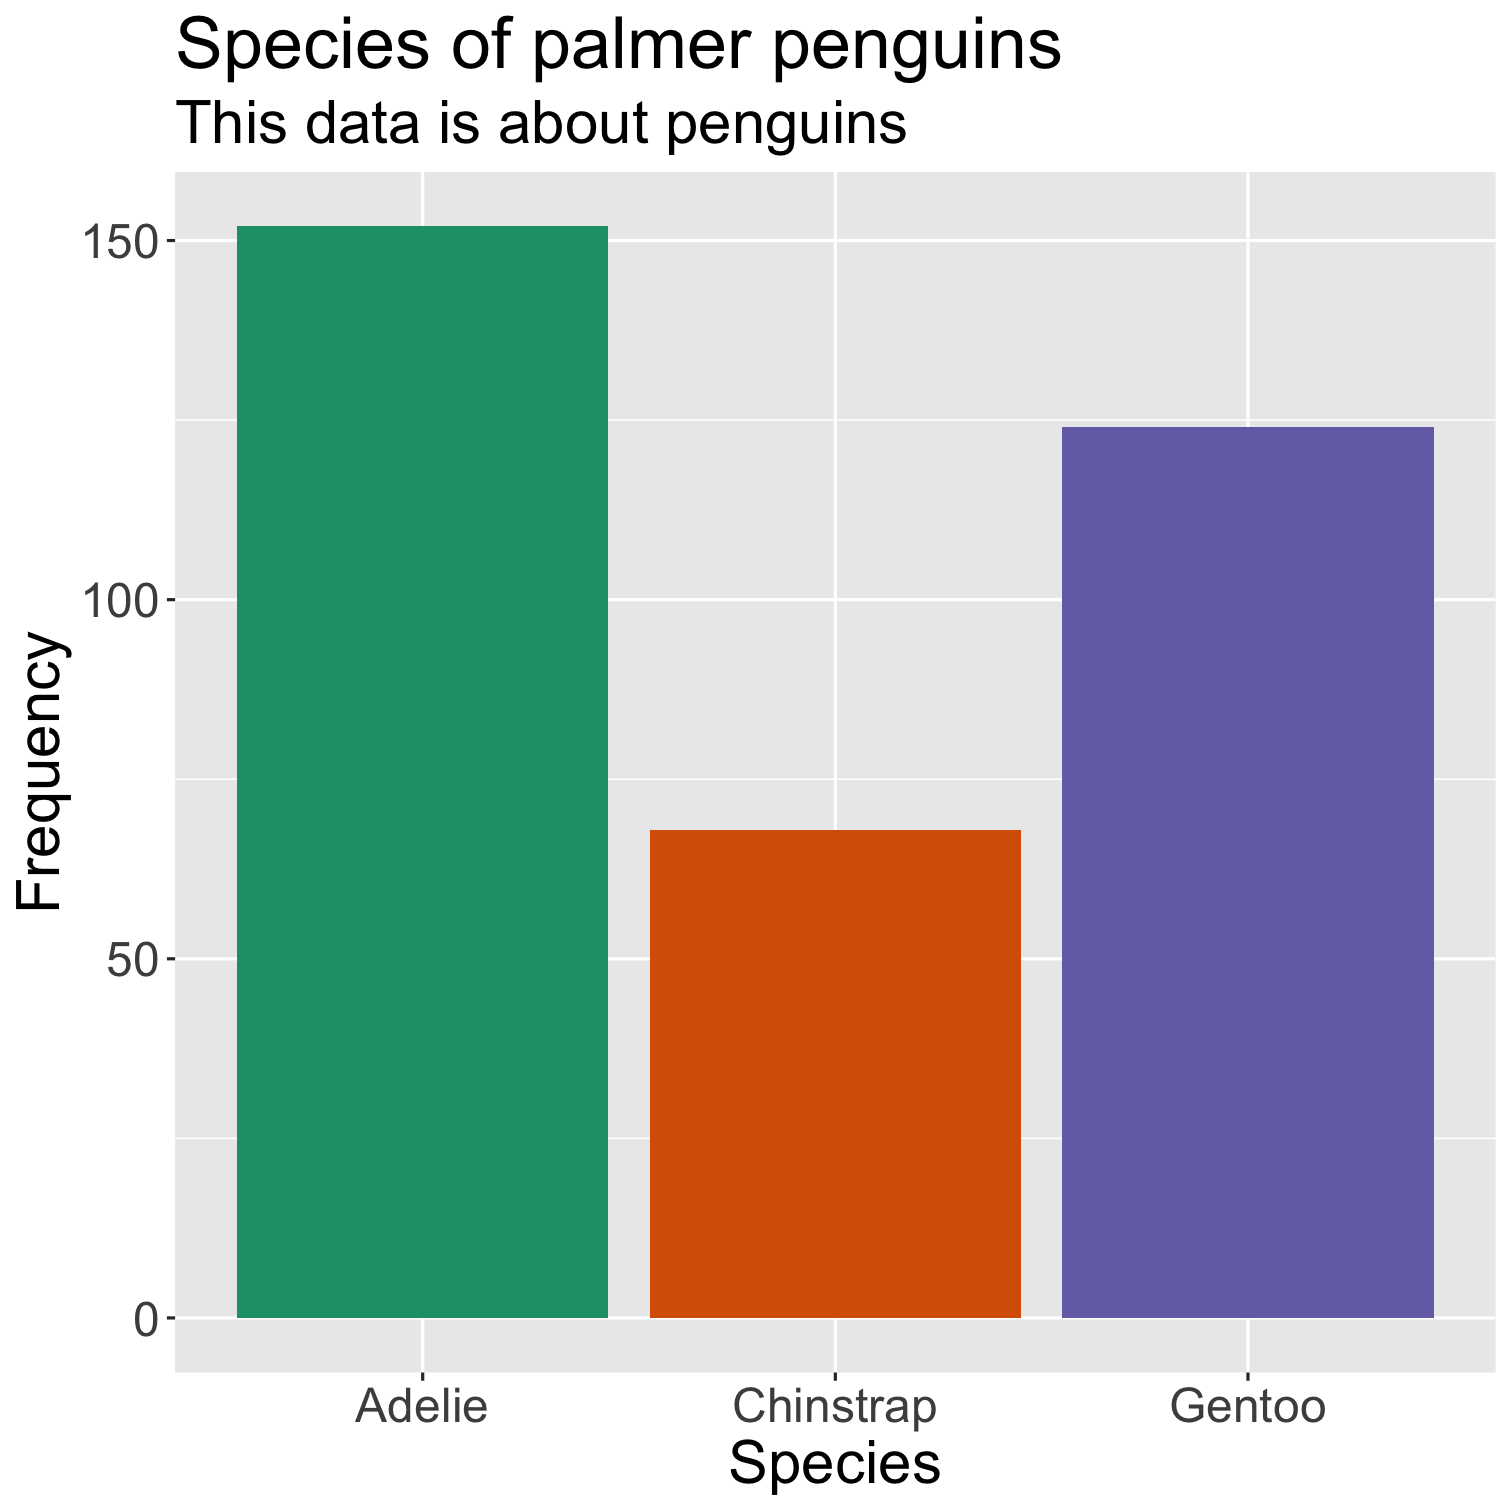
ggplot(data = penguins, mapping = aes(x = bill_length_mm, y = bill_depth_mm, color = species)) + geom_point() + scale_fill_brewer(palette = "Dark2") + theme(legend.position = "none", text = element_text(size = 20)) + labs( title = "Relationship between bill length \n& depth of palmer penguins", subtitle = "This data is about penguins", x = "Bill length (mm)", y = "Bith depth (mm)" )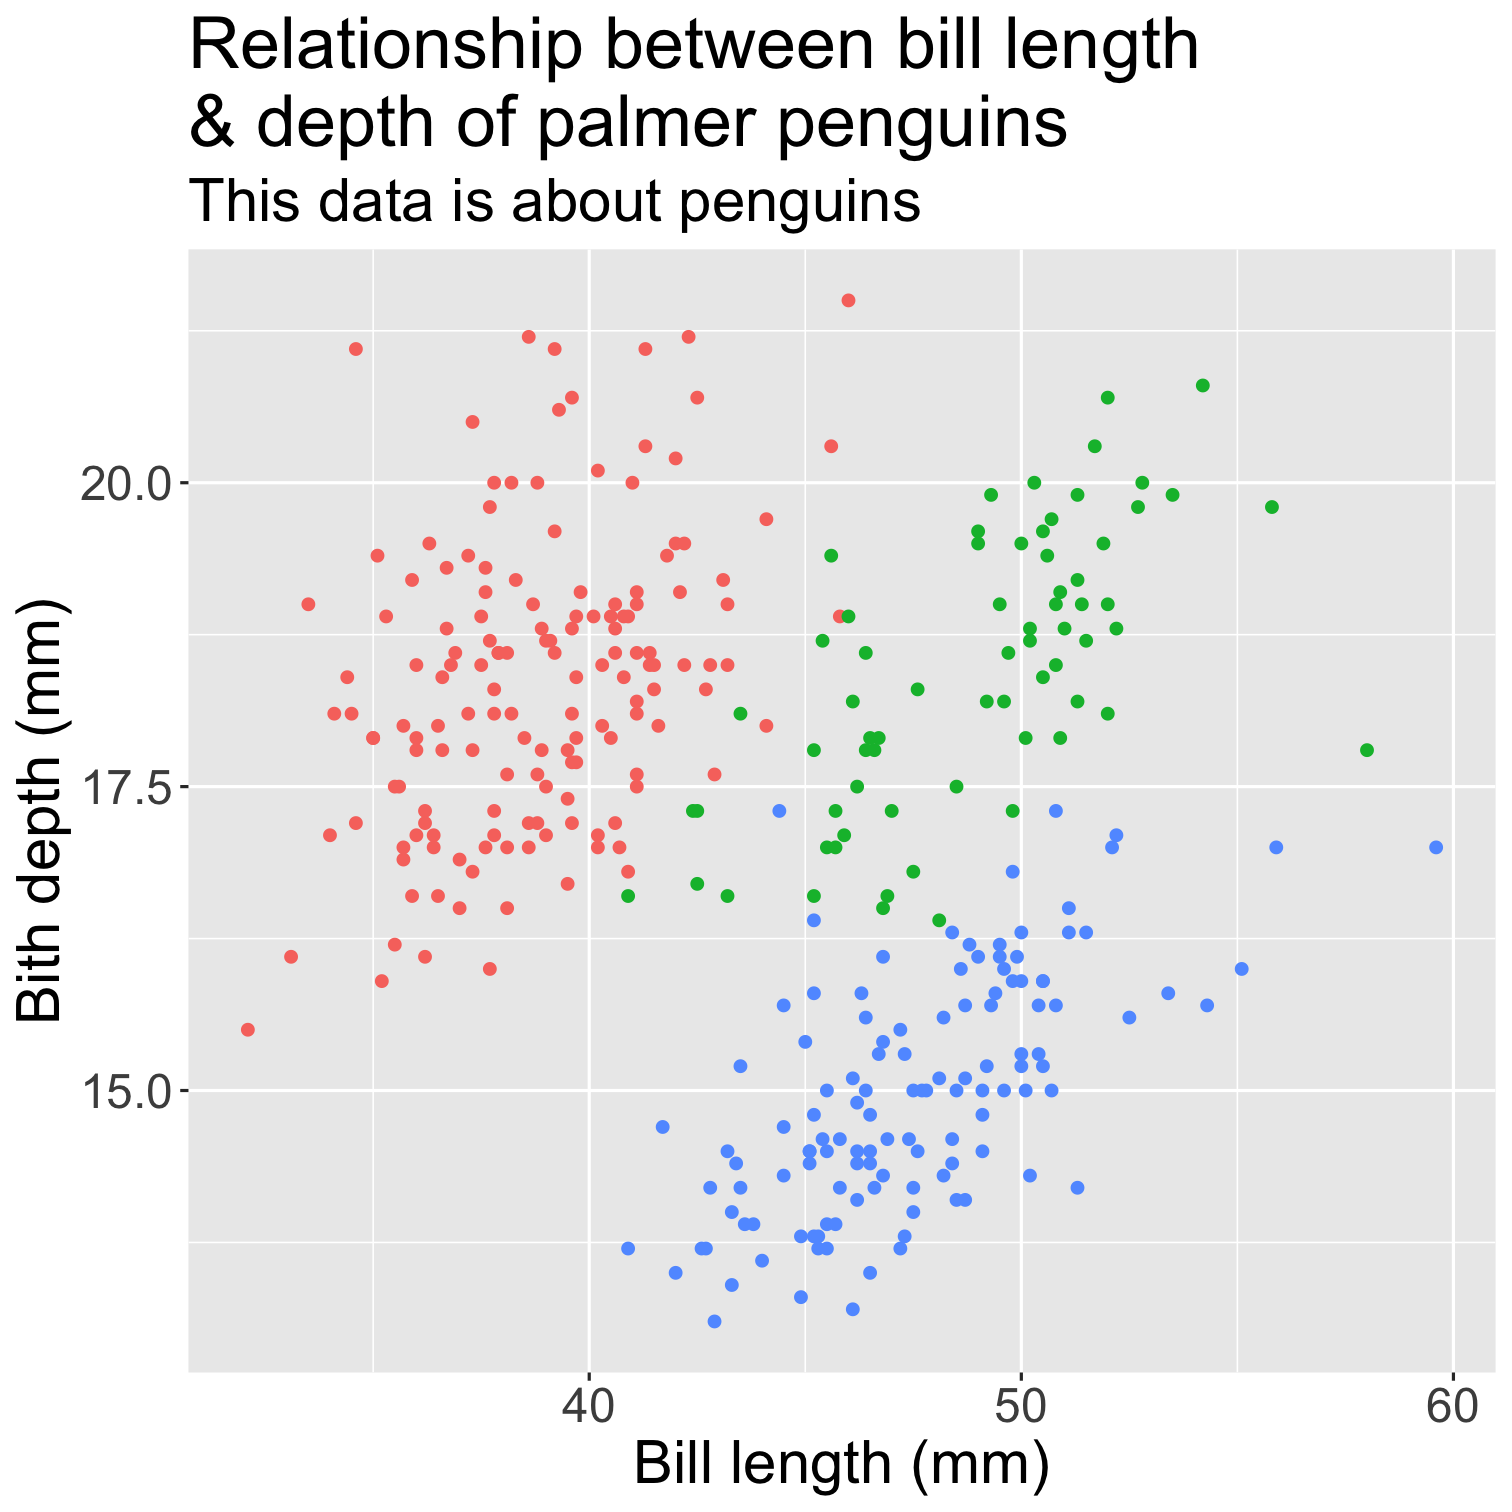
ggplot(data = penguins, mapping = aes(x = bill_length_mm, y = bill_depth_mm, color = species)) + geom_point() + scale_fill_brewer(palette = "Dark2") + theme(legend.position = "none", text = element_text(size = 20)) + labs( title = "Relationship between bill length \n& depth of palmer penguins", subtitle = "This data is about penguins", x = "Bill length (mm)", y = "Bith depth (mm)" ) + theme_bw()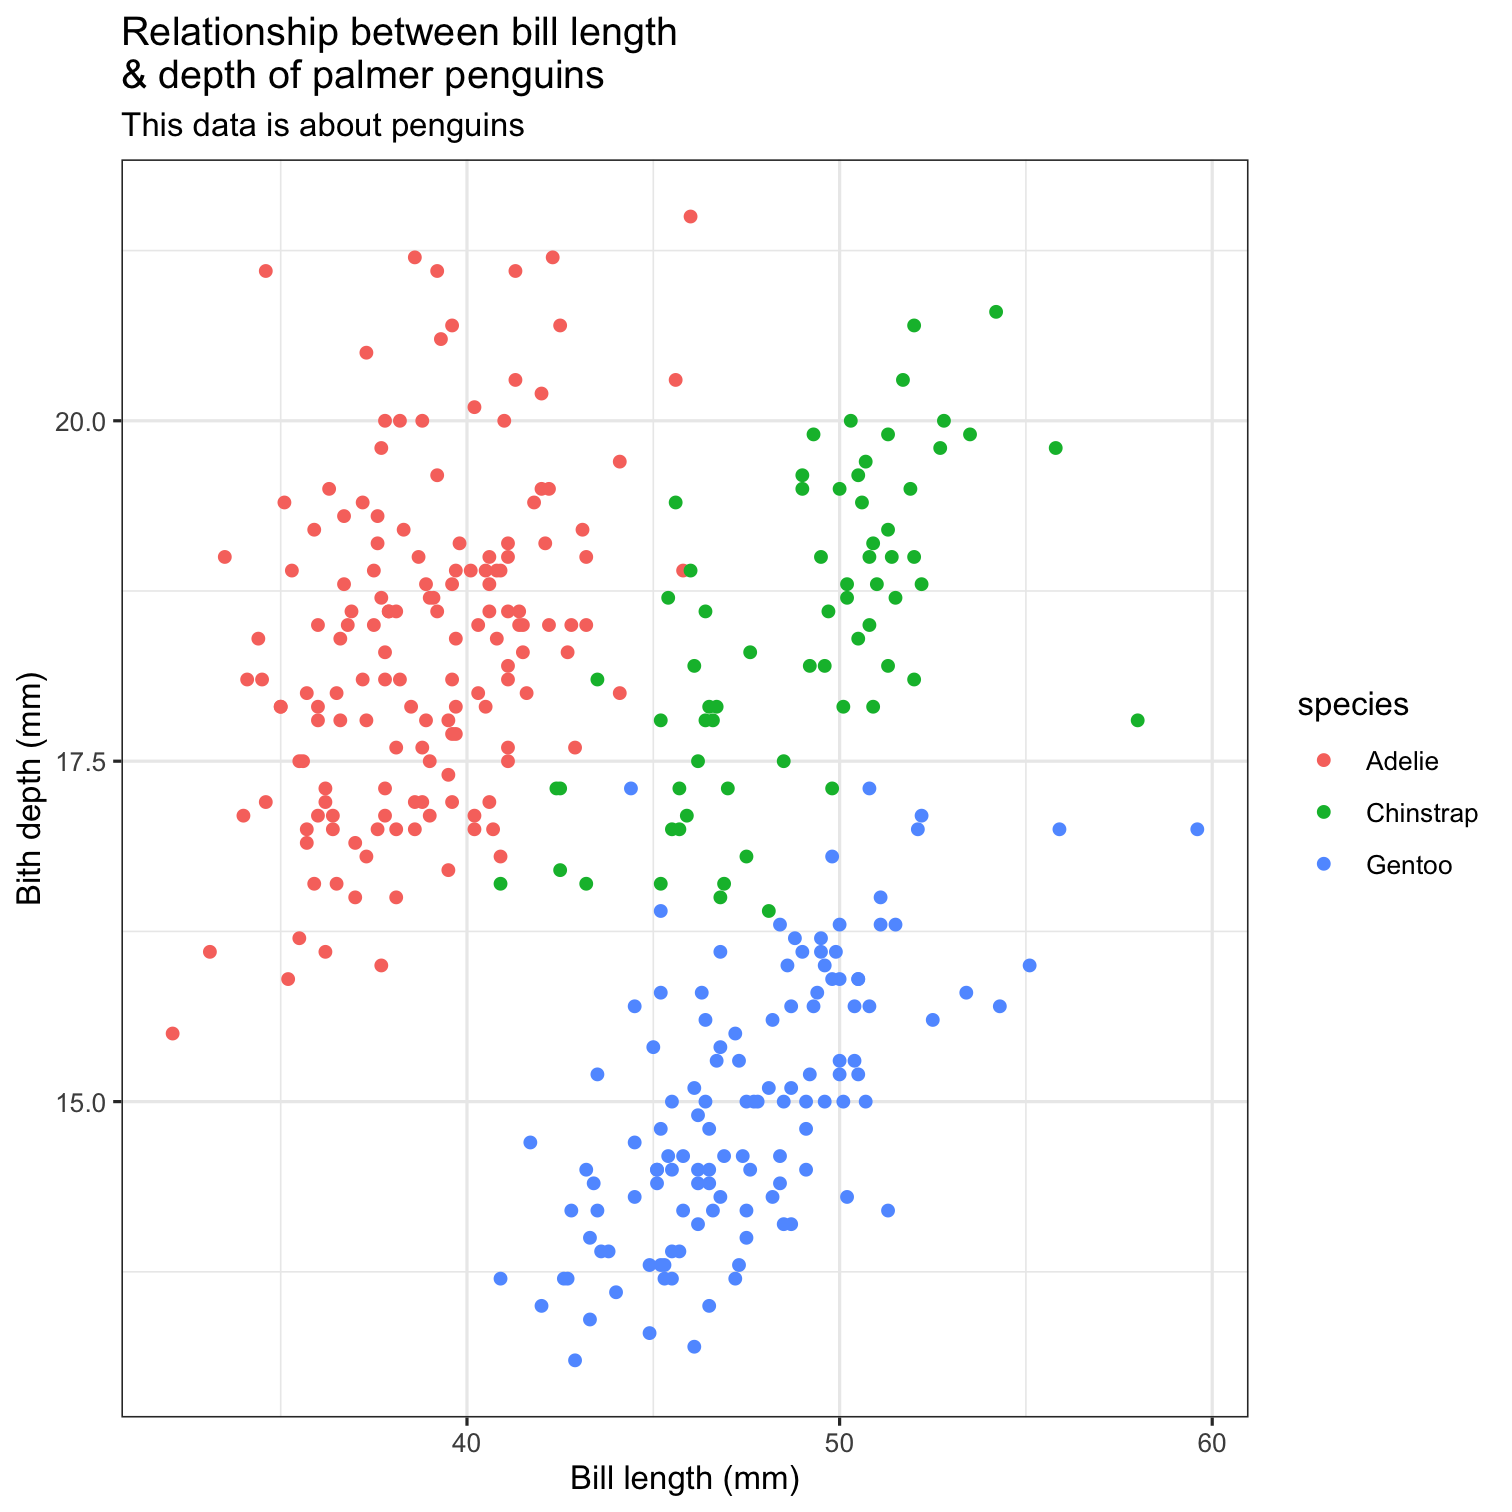
ggplot(data = penguins, mapping = aes(x = bill_length_mm, y = bill_depth_mm, color = species)) + geom_point() + scale_fill_brewer(palette = "Dark2") + theme(legend.position = "none", text = element_text(size = 20)) + labs( title = "Relationship between bill length \n& depth of palmer penguins", subtitle = "This data is about penguins", x = "Bill length (mm)", y = "Bith depth (mm)" ) + theme_classic()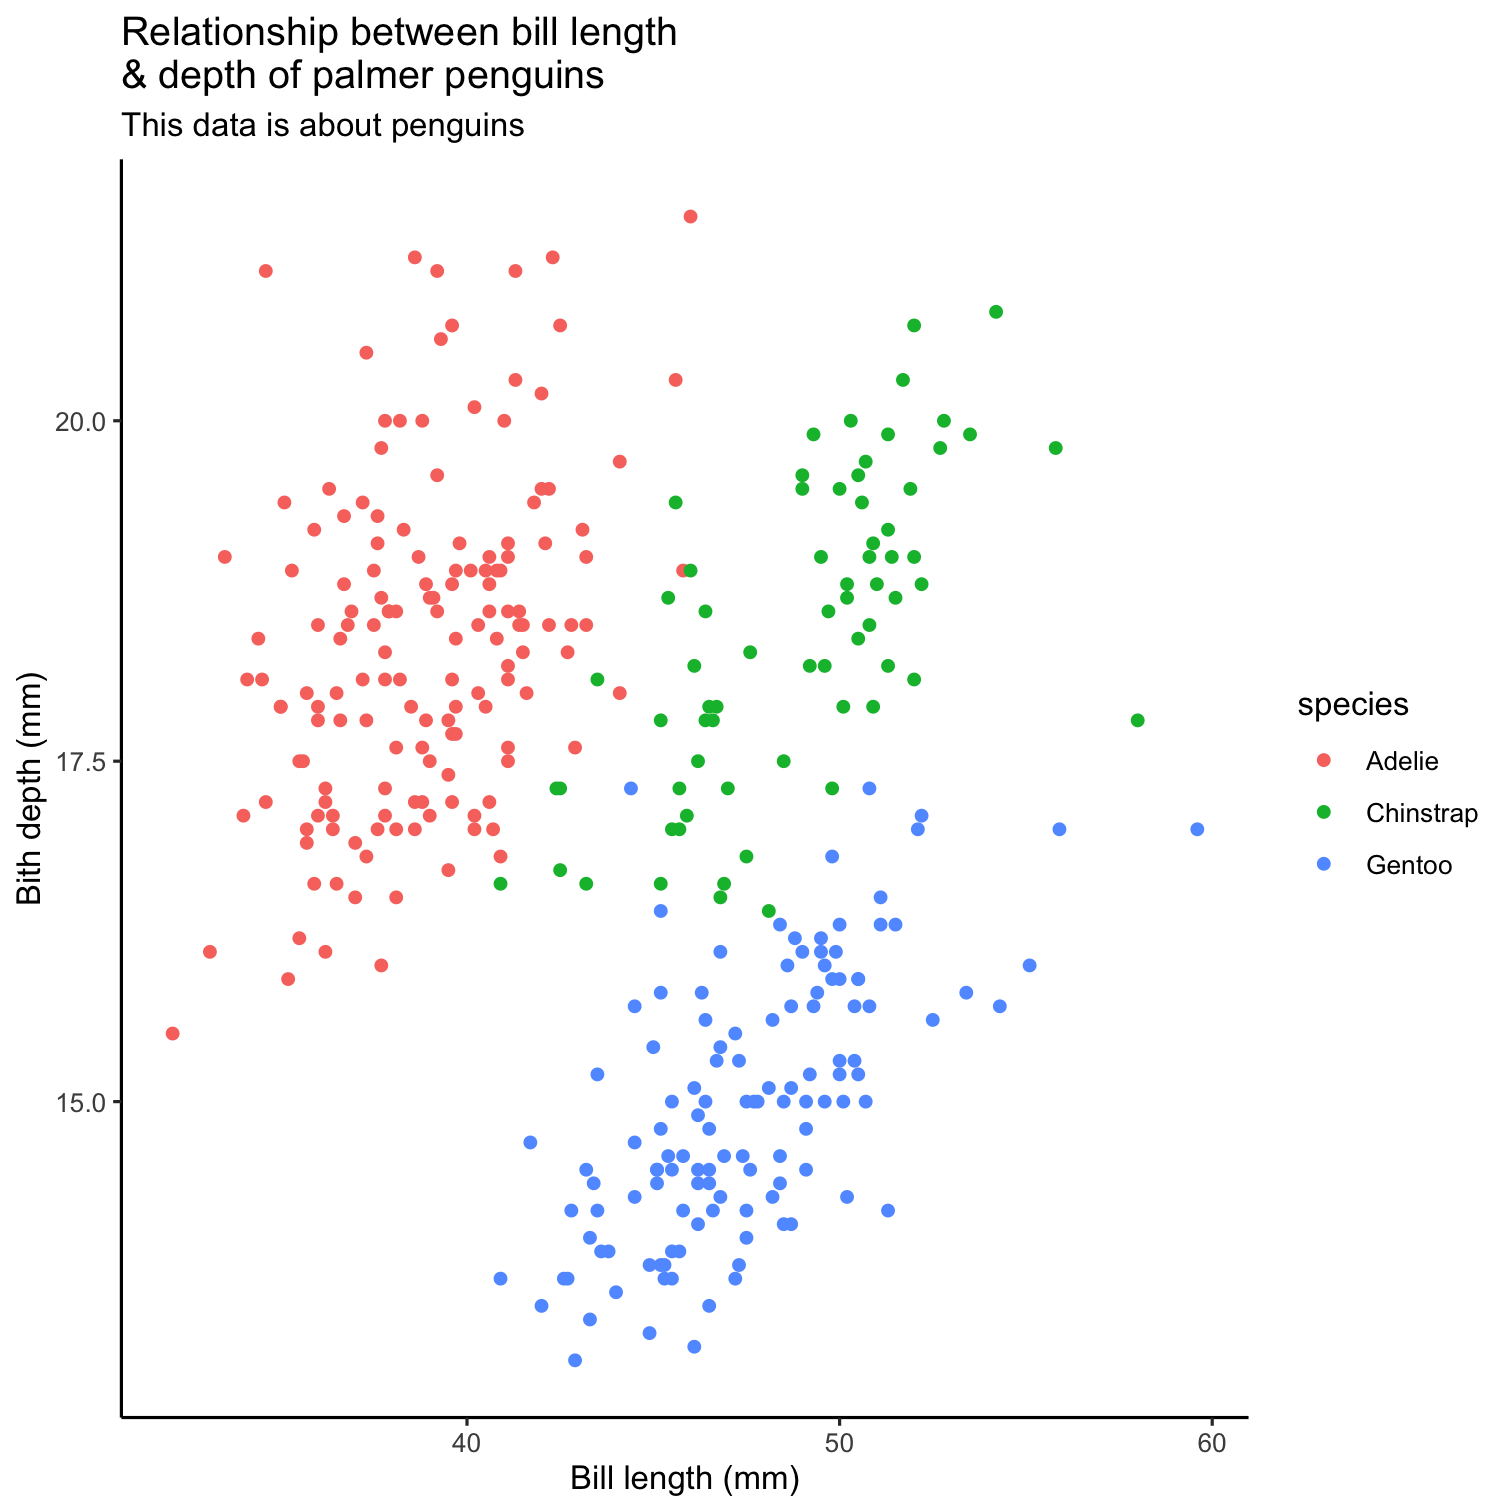
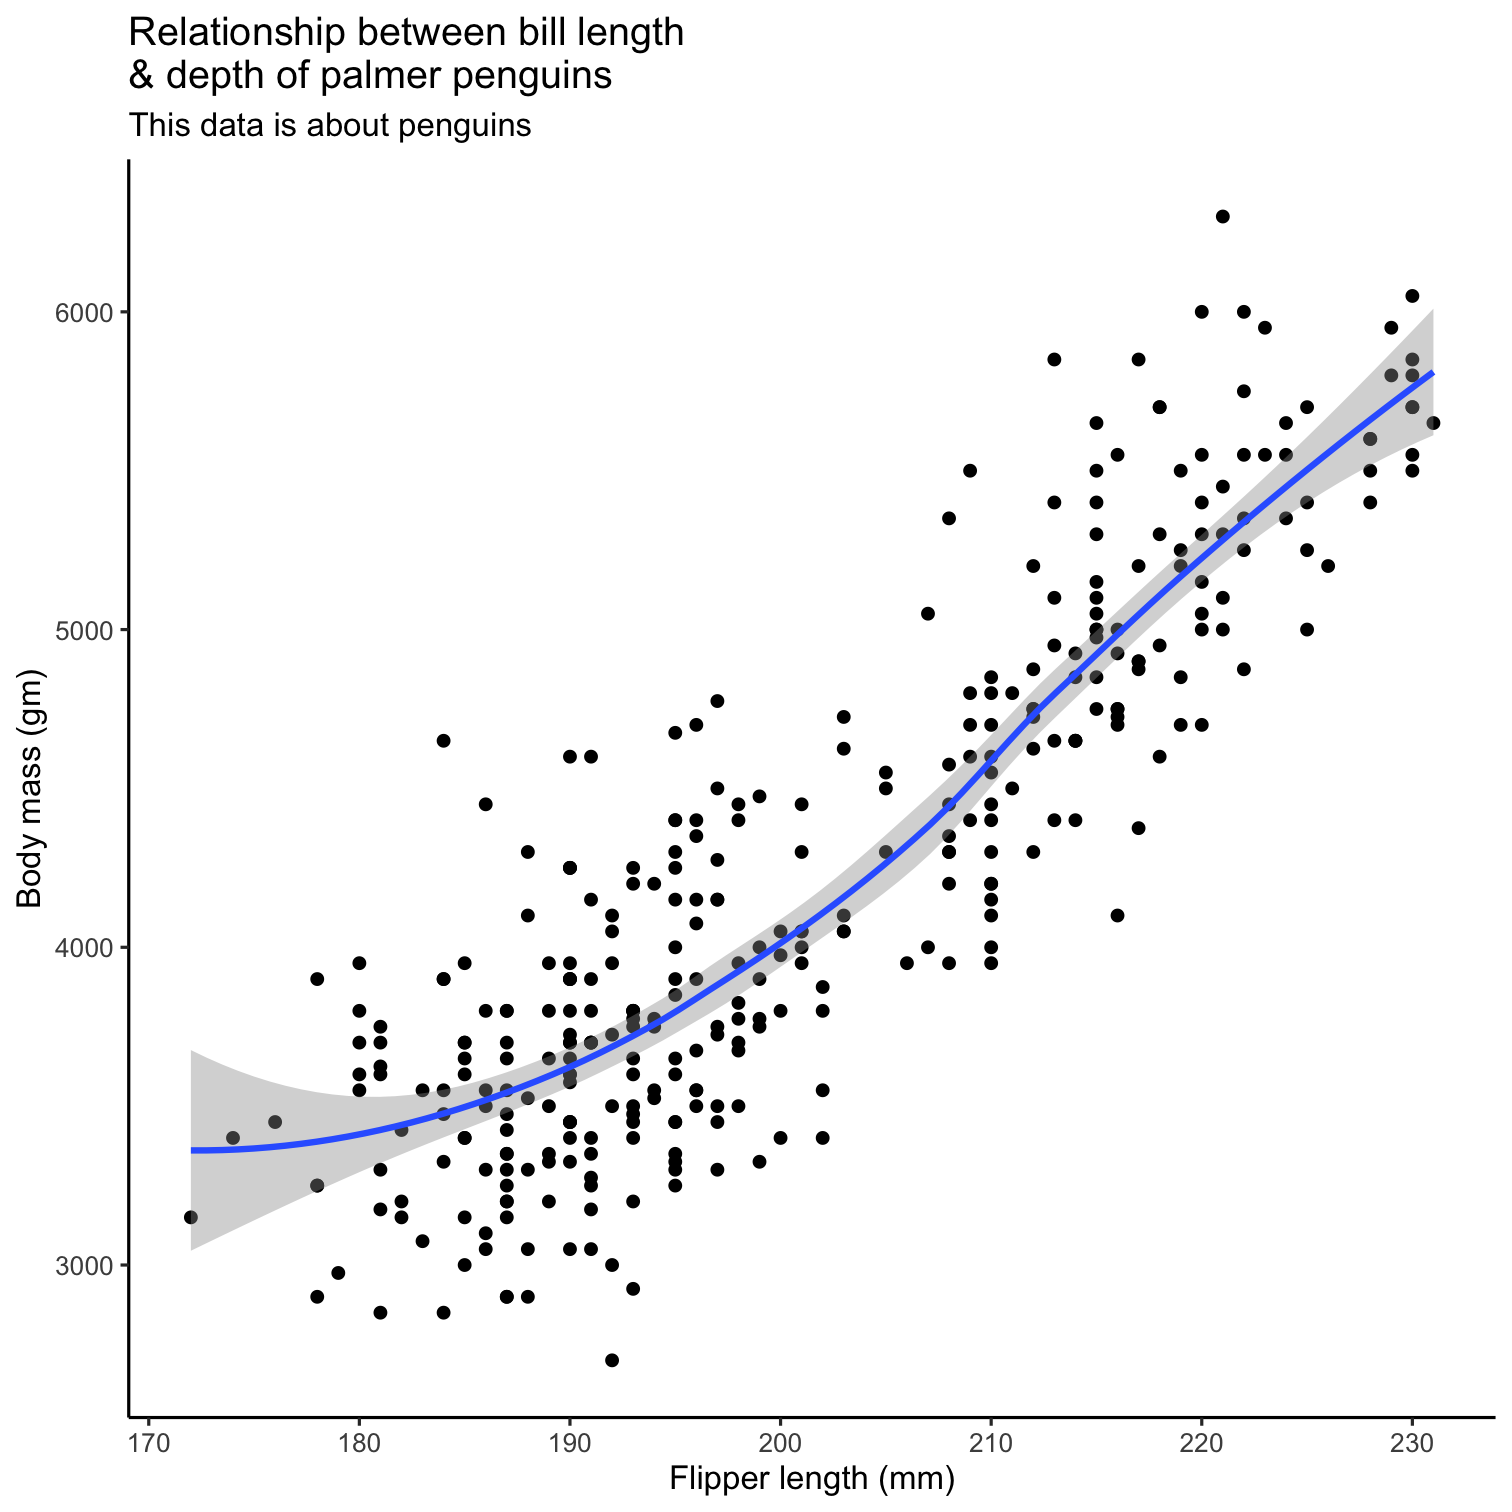
ggplot(data = penguins, mapping = aes(x = flipper_length_mm, y = body_mass_g)) + geom_point() + theme(legend.position = "none", text = element_text(size = 24)) + labs( title = "Relationship between bill length \n& depth of palmer penguins", subtitle = "This data is about penguins", x = "Flipper length (mm)", y = "Body mass (gm)" ) + theme_classic() + geom_smooth()